
Extended Data Fig. 3 |. Correlation between video metrics.
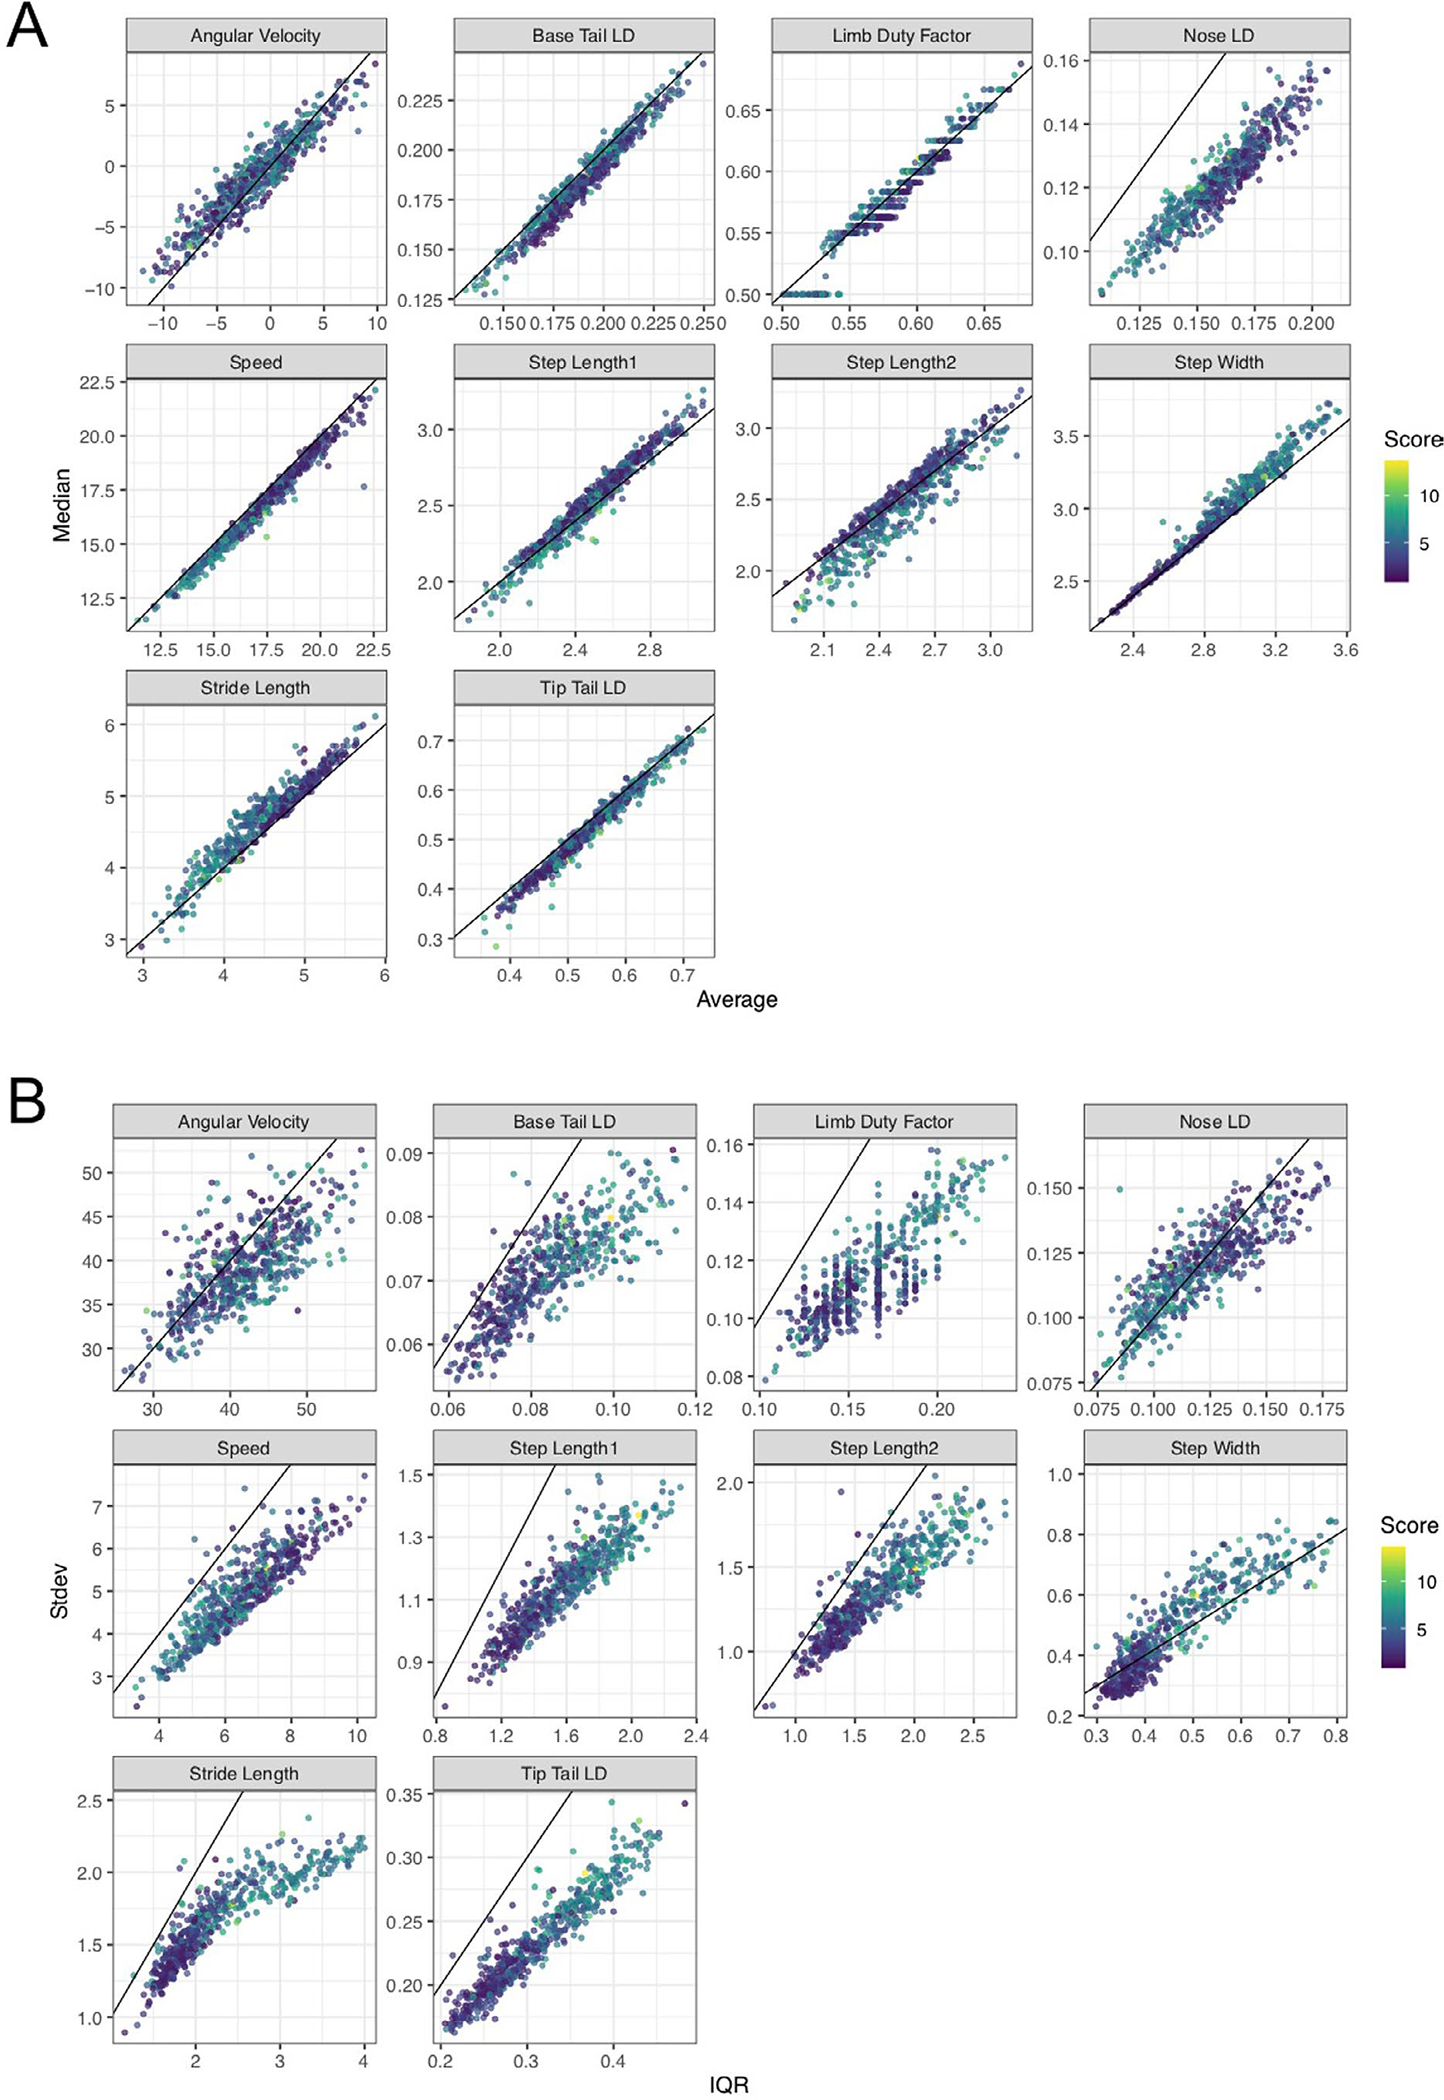
A, Correlation between average/mean (x-axis) and median (y-axis) video gait metrics. The diagonal line corresponds to maximum correlation i.e. 1. B, Correlation between inter-quartile range (IQR, x-axis) and standard deviation (Stdev, y-axis) video gait metrics. The diagonal line corresponds to maximum correlation i.e. 1. A tight wrap of points around the diagonal line indicates a high correlation between mean and median or IQR and standard deviation for the respective metric.