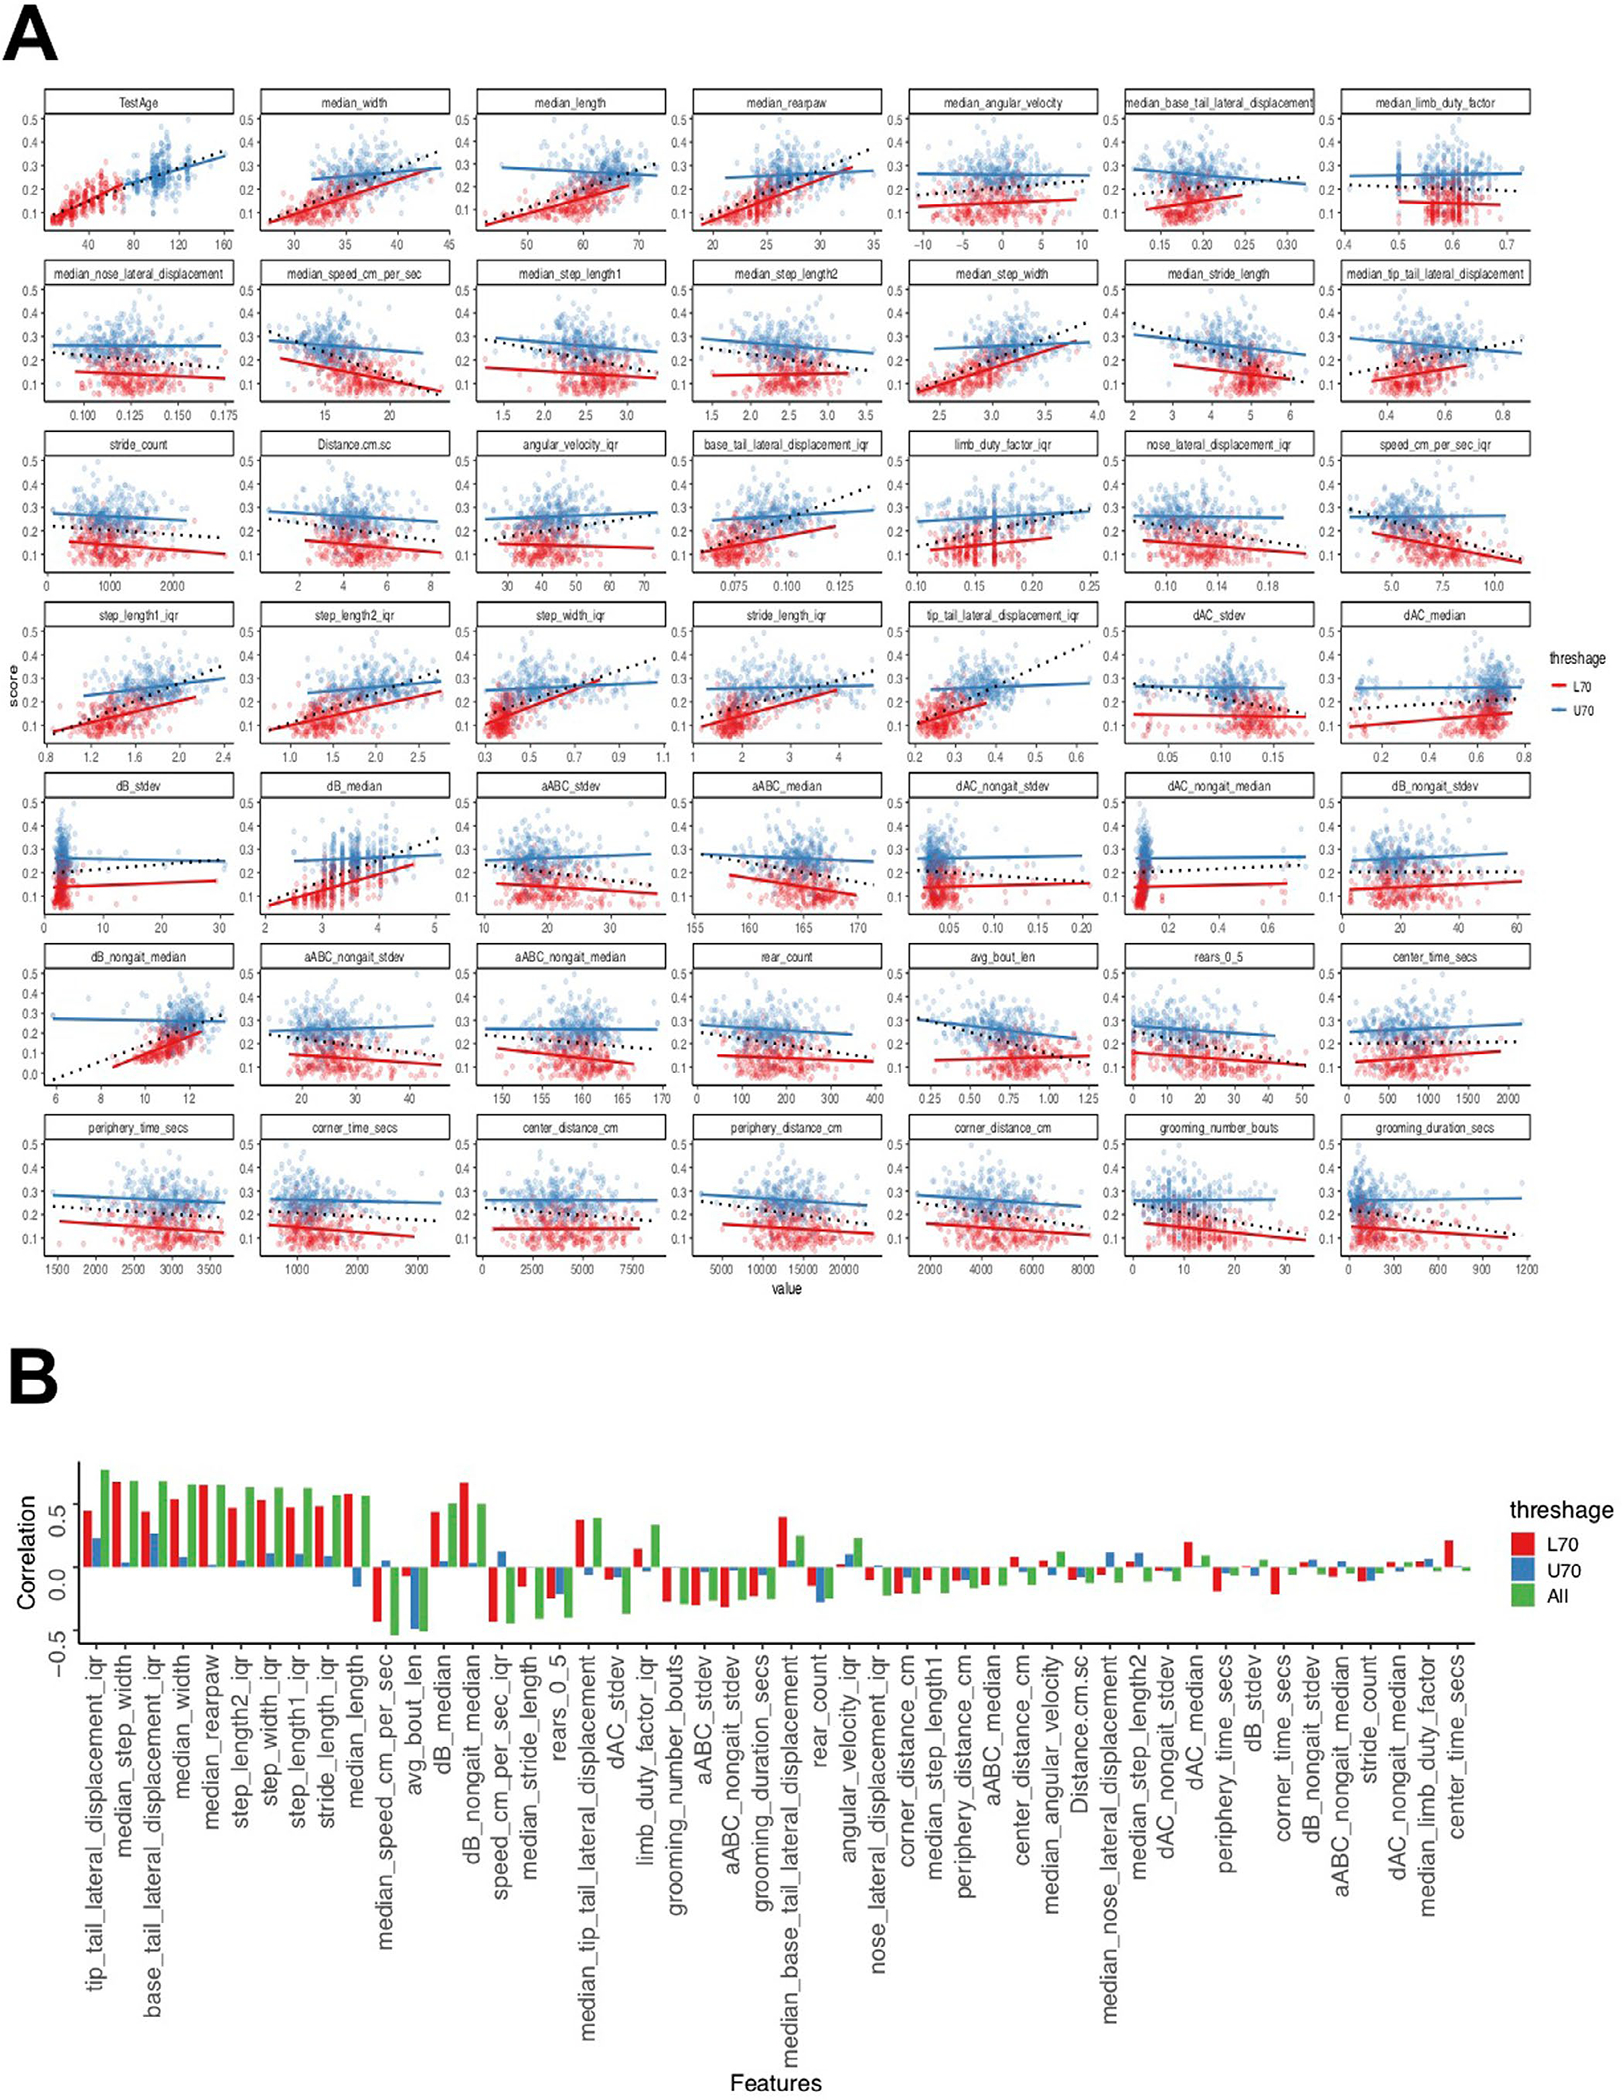
Extended Data Fig. 4 |. test for Simpson’s paradox.

A, Simpson (1951) showed that the statistical relationship observed in the population could be reversed within all of the subgroups that make up that population, leading to erroneous conclusions drawn from the population data. To test for the manifestation of Simpson’s paradox in our data, we split the bimodal Age distribution into two separate unimodal distributions (clusters), that is, less than 70 weeks old (L70, red) versus more than 70 weeks old (U70, blue). Next, we plotted the dependent variable (frailty) against each of the independent variables/features in our data and fit a simple linear regression model to each subgroup separately (solid red and blue lines) as well as to the aggregate data (black dotted line). B, We quantified the correlations by measuring the slope of the linear fits of the features (Y) on Age (X). We computed the slopes for L70, U70 and overall (All), then plotted the slopes for features in decreasing order of their relevance to the model (where we predict Age from these features). We went further and performed one-way ANOVA to test for differences in slopes between L70 and U70 sub-groups and the overall data (one-way ANOVA, F2,141 = 1.162, p > 0.32). Next, we performed a false discovery rate adjusted post hoc pairwise comparisons using the t-test. We found no significant differences in the comparisons (L70 versus U70, p = 0.38, L70 versus All, p = 0.77 and U70 versus All, p = 0.38). We found that Simpson’s paradox does not manifest in any of the top fifteen features in our data.
