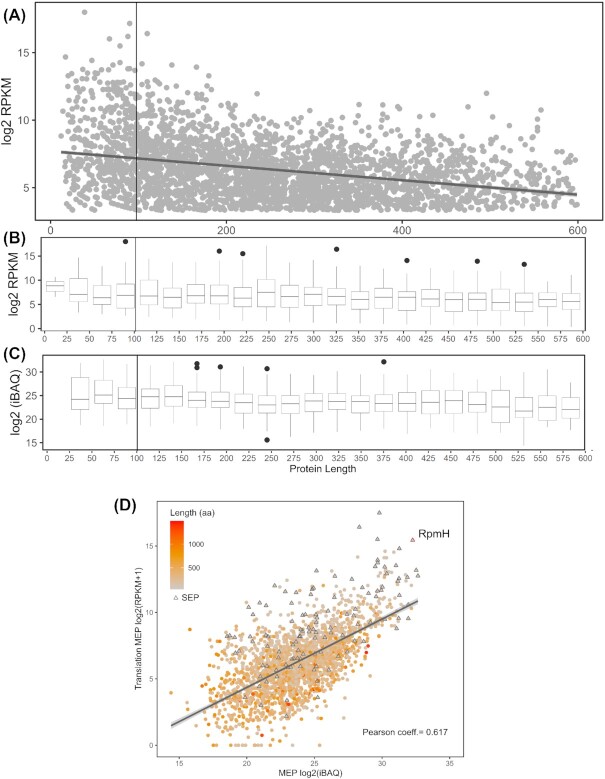
Figure 3.
Protein Ribo-seq expression levels in function of protein length. (A) Log2-transformed RPKM values of all annotated proteins smaller than 600 aa. (B) Box plot depicting distribution of translation values per protein length bin. (C) Abundance of annotated proteins detected in the proteomics experiments as measured by log2(iBAQ) values in function of protein length. (D) Correlation between proteomics and translation as measured by ribosome profiling in MEP (OD 0.3 in LB medium). The protein length is marked on a color scale with proteins smaller than 100 aa indicated with triangles. Pearson correlation coefficients are marked in respective graphs. The robustly expressed RpmH SEP described in the text is highlighted. The quantification of RpmH is highlighted as an example of robustly expressed SEP (see manuscript text for details).

