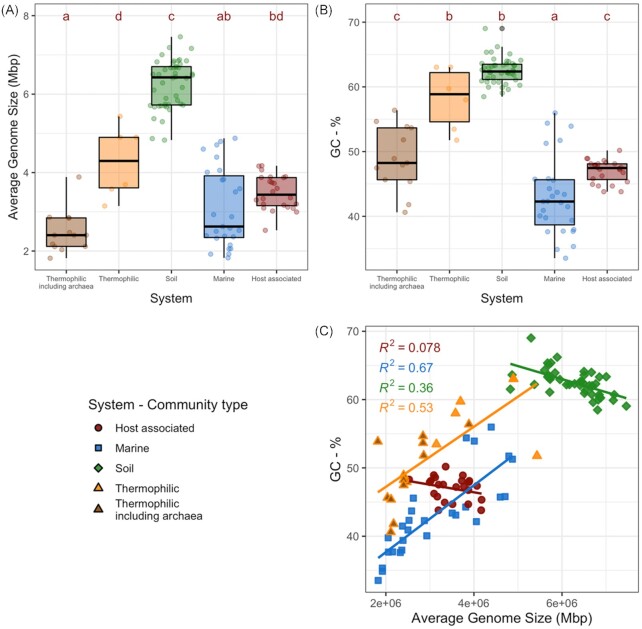
Figure 1.
Average genome size and GC-content calculated from environmental metagenomes. (A) Boxplots of the average genome size (Mbp) of microbial communities in different ecosystems. (B) Boxplots showing GC-% between systems. (C) GC-% as a function of average genome size (Mbp) of a metagenome, separated by system. Point shape and outline represent source system; point fill represents system including thermophilic samples with archaea.

