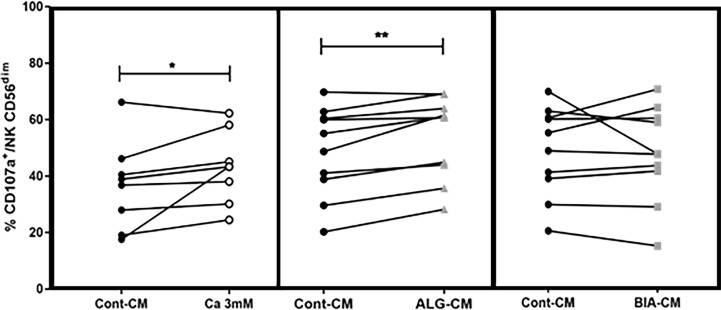
Figure 2.
Degranulation of NK cells. The CD107a surface expression was assessed on viable CD56+dim cytotoxic cells by flow cytometry after NK cells incubation with K562 cells at a 1:1 ratio for 18h in the presence of CaCl2 solution at 3mM (white circle, left side), ALG-CM (grey triangle, middle), and BIA-CM (light grey square, right side) versus control (black circle). Each line links data from the same donor (n=8 for Ca 3mM; n=10 for ALG-CM and BIA-CM). Statistical comparison of data versus control CD107a expression was assessed using Wilcoxon paired test. *p<0.05, **p<0.01.

