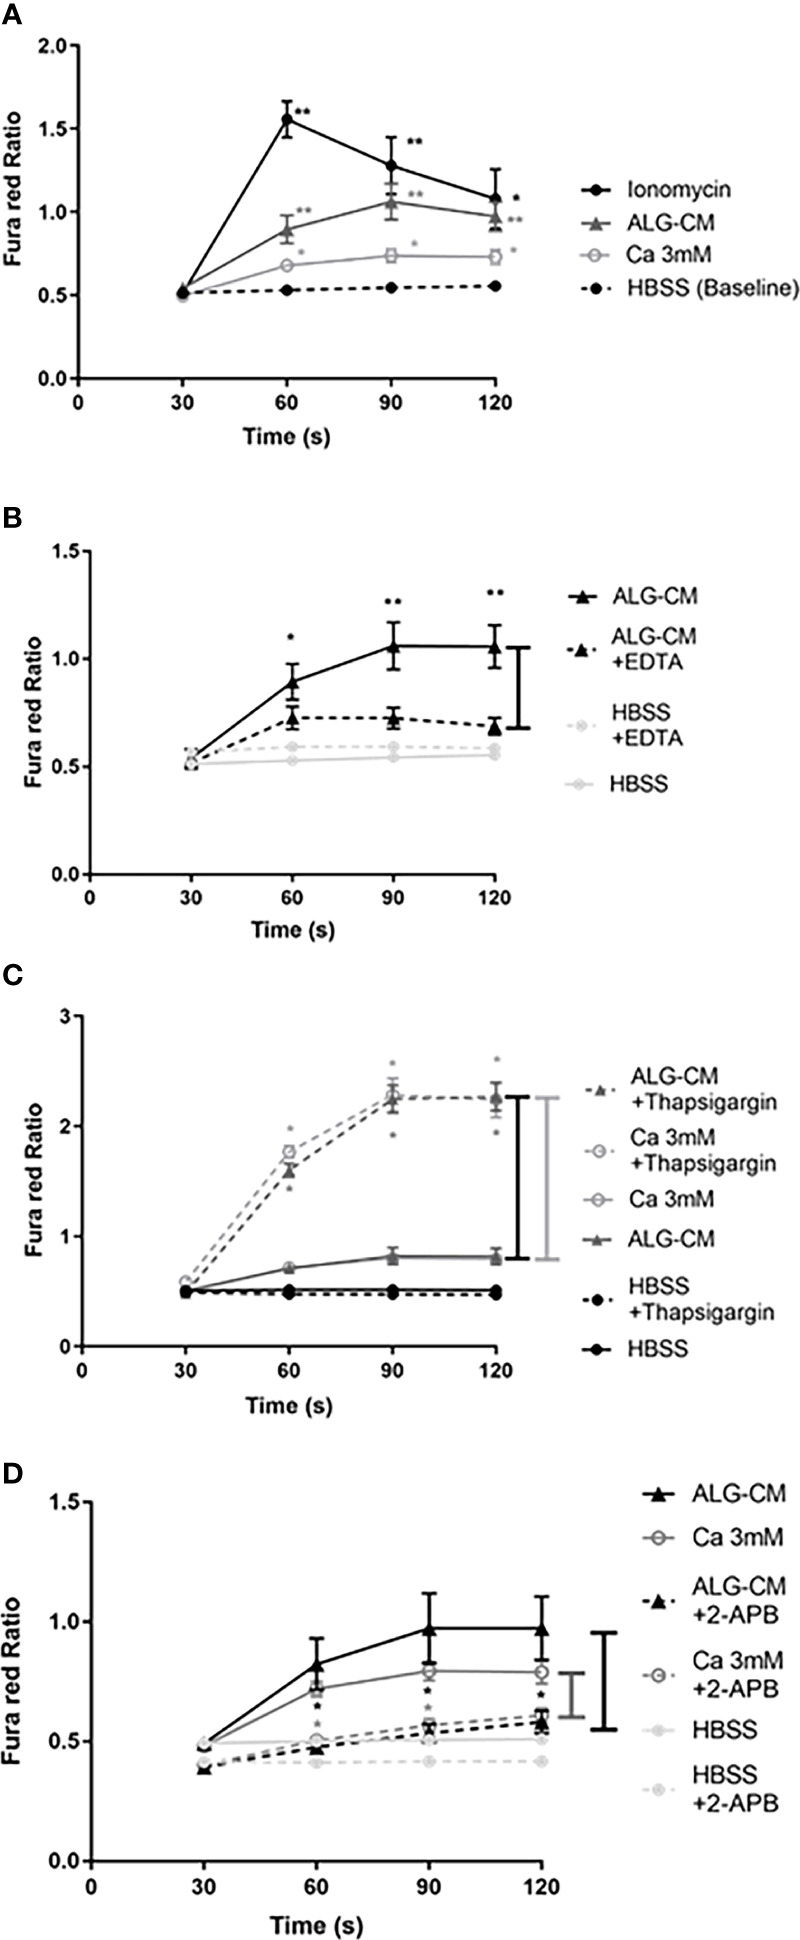
Figure 4.

Fura red-AM Cytoplasmic calcium influx in NK cells. Time-dependent calcium influx in NK cells was measured by the Fura red Ratio detected every 30 seconds until 120s in each time interval (30s, 60s, 90s, and 120s) in HBSS solution. Ca2+ influx was measured after: (A) the addition of ionomycin as a positive control (1µg/ml) (circle, fill line), CaCl2 solution at 3mM (white circle), ALG-CM (triangle), compared with control HBSS solution (baseline); (B) chelation of extracellular Ca2+ released from ALG-CM using EDTA (10mM) diluted in conditioned medium (triangle, detached line) versus ALG-CM without EDTA (triangle, full line) or EDTA (10mM) diluted in HBSS (light grey circle, detached line) versus HBSS without EDTA (light grey circle, full line); (C) calcium store depletion with Thapsigargin (1µM), in the presence of CaCl2 solution at 3mM (white circle) or ALG-CM (triangle); (D) blockade of Ca2+ permeable channels 2-APB (100µM) in the presence of CaCl2 solution at 3mM (white circle) or ALG-CM (triangle) or HBSS (light grey circle). Results are the mean ± SEM of independent experiments, using Wilcoxon paired test for statistical comparison to (A) HBSS baseline at each time interval with n=9, to (B) respective media without EDTA with n=9, to (C) respective media without Thapsigargin with n=6 or to (D) respective media without 2- APB with n=6. *p<0.05, **p<0.01.
