
Figure 5.
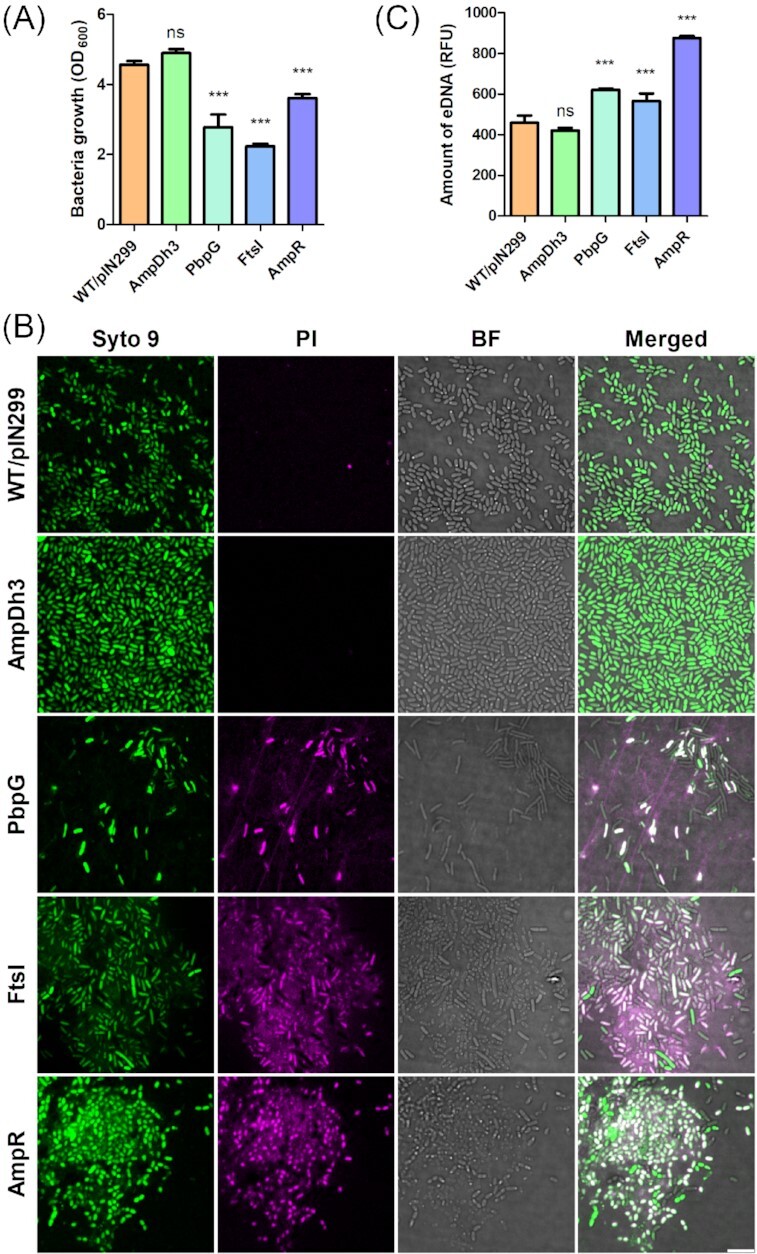
Self-toxicity of PAO1 derivatives overexpressing PG-modifying enzymes. Bacteria from an overnight culture were inoculated in LB at an initial OD600 of 0.01. Following 3 h of growth, 2% rhamnose was added. After 16 h of incubation, bacterial cell densities were determined (A) and samples were inspected by bright field microscopy (BF) and CLSM (B). Bacterial cells were stained with Syto 9 (green) and dead cells were visualized by staining with propidium iodide (PI, magenta). Bar indicates 5 µm. We also quantified the amounts of eDNA in the supernatants of the tested strains by staining with SYTOX (C). Data are presented as mean±SD from triplicate measurements and significant differences between groups were determined by one-way ANOVA followed by Dunnett's post-hoc test. *, P< 0.05; **, P< 0.01; ***, P< 0.001; ns, not significant.