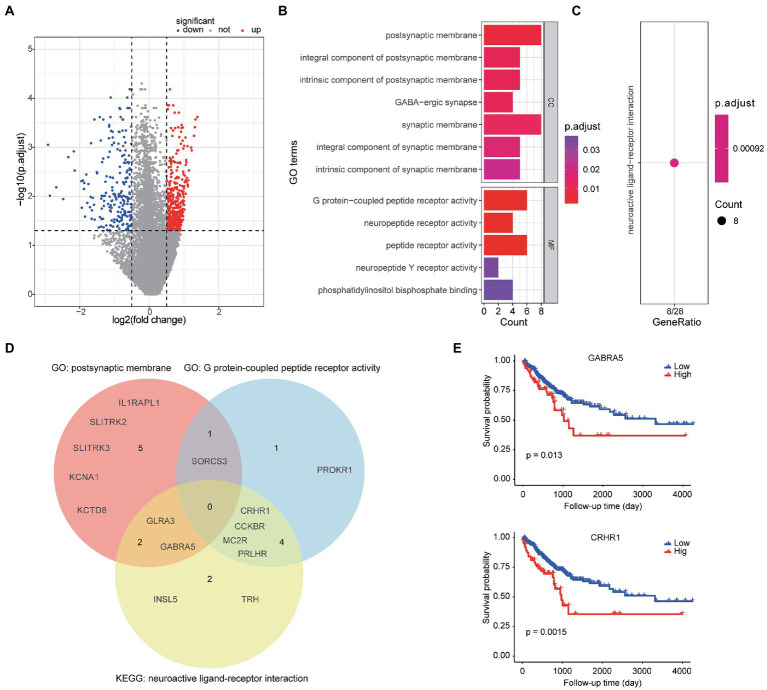
Figure 4.
Bioinformatics analyses of TME signature associated biologic basics. (A) Volcano plot of gene expression between the high-TME signature group and the low-TME signature group. (B) The significantly enriched GO terms. (C) The significant enriched KEGG pathways. (D) Venn diagram of the gene symbols that involved in two significant GO terms and a KEGG pathway. (E) Two genes significantly associated to PFS.

