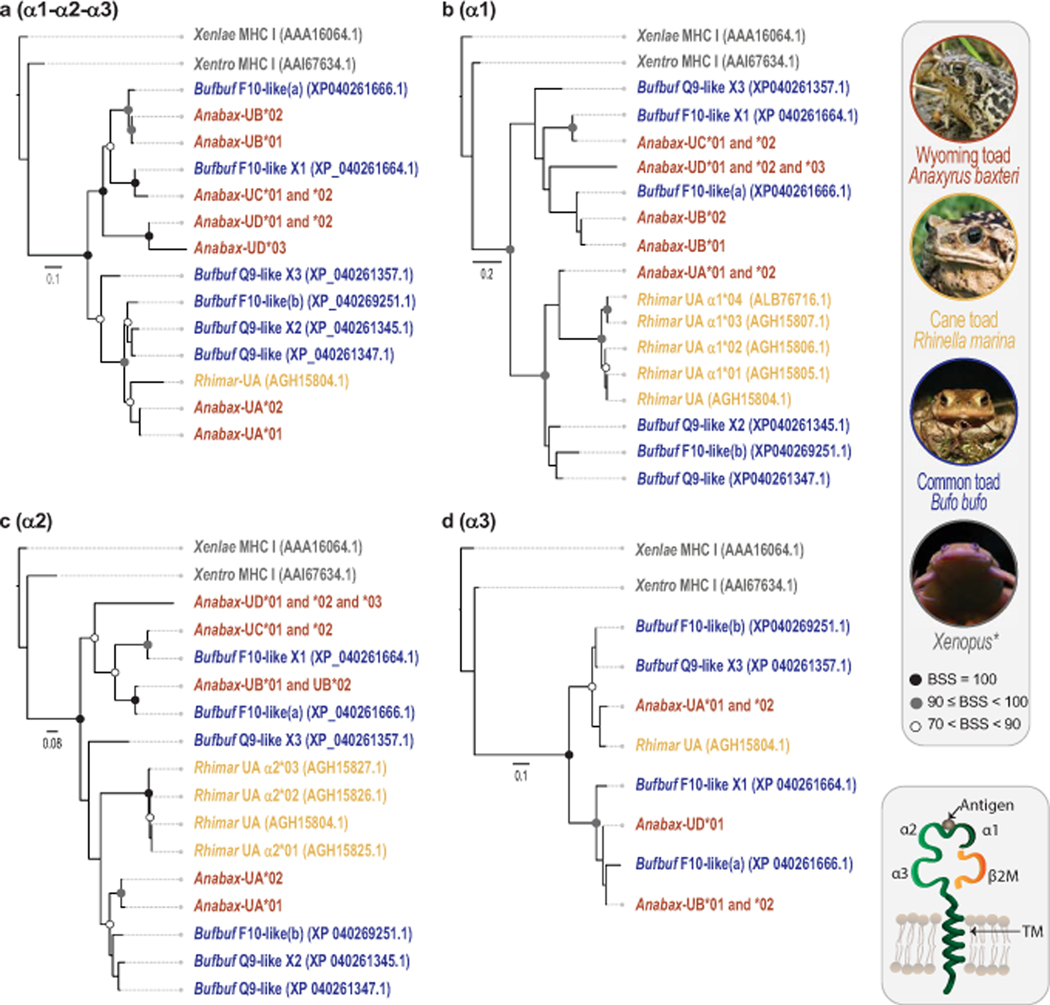
Fig. 3. Phylogenetic comparison of Wyoming toad MHC class I sequences to other anurans.
Phylogenetic trees comparing Wyoming toad (Anabax) MHC class I protein sequences to those of common toad (Bufbuf), cane toad (Rhimar), Xenopus laevis (Xenlae) and Xenopus tropicalis (Xentro). Trees were generated using alignments of (a) contiguous α1-α2-α3 domains or by using individual protein domains; (b) α1, (c) α2, and (d) α3. Note that Bufbuf “F10-like(b)” is likely a “Q9-like” sequence and inaccurately annotated. Circles at nodes indicate bootstrap support values (BSS) with filled black circles indicating BSS=100, gray circles indicating BSS values equal to or greater than 90 but less than 100, and white circles indicating BSS values greater than 70 but less than 90. Scale bar indicates substitutions over time.

