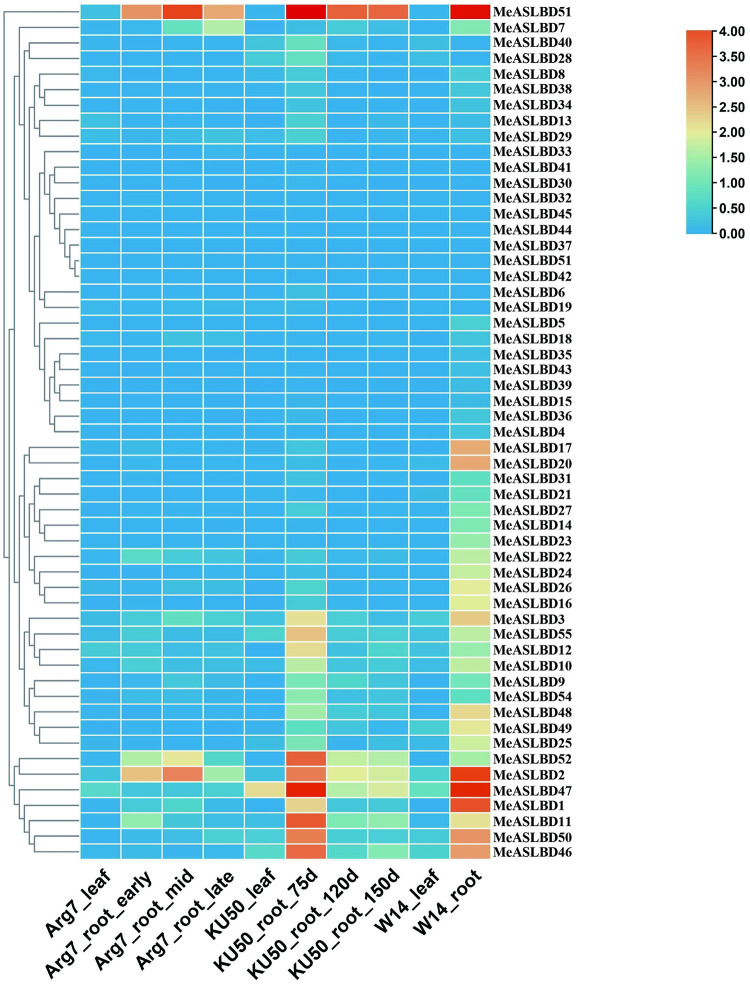
Fig 7. Expression pattern analysis of MeASLBD transcription factors in roots and leaves.
Red indicates high expression, and blue indicates low expression. The colour scale shows RPKM values normalised by log2. Different tissues (leaves and roots) of the cassava cultivars Arg7, W14, and KU50 were analysed. The Arg7_leaf, KU50_leaf, and W14_leaf stand for leaves. And Arg7_root, KU50_root, and W14_root stand for root. Early, mid and late represent the stages. d = days.

