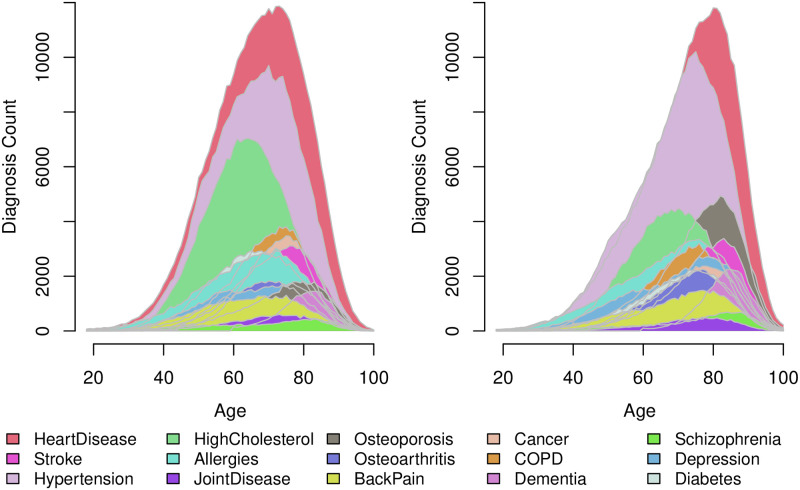
Fig 2. Diagnosis counts by age for the population of Danish chronic heart disease diagnosed individuals in the period 1995–2015.
The figure shows males (left) and females (right). A diagnosis is counted when the individual obtains the algorithmic chronic disease diagnosis. The diagnoses are ordered, so diagnoses with larger variance in counts are on top.

