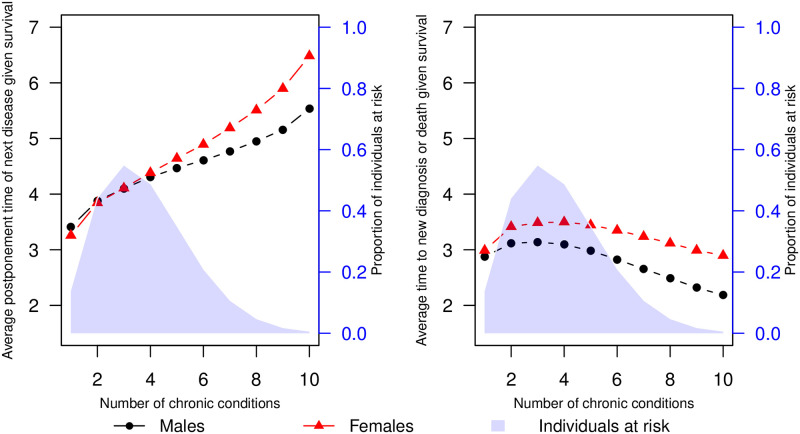
Fig 4. Effect of multimorbidity on postponement times.
Estimated mean postponement time of next chronic diagnosis given survival for retired males and females of no education at a set multimorbidity level (left). The mean postponement times are estimated as an average of estimated postponement times for all possible combinations of chronic conditions given the multimorbidity level, weighted by the observed frequency of these combinations. The blue shaded area represents the proportion of HD individuals at risk of a new event. For reference, the right plot represents the same estimates in a model where the new disease event and death are considered a combined event.

