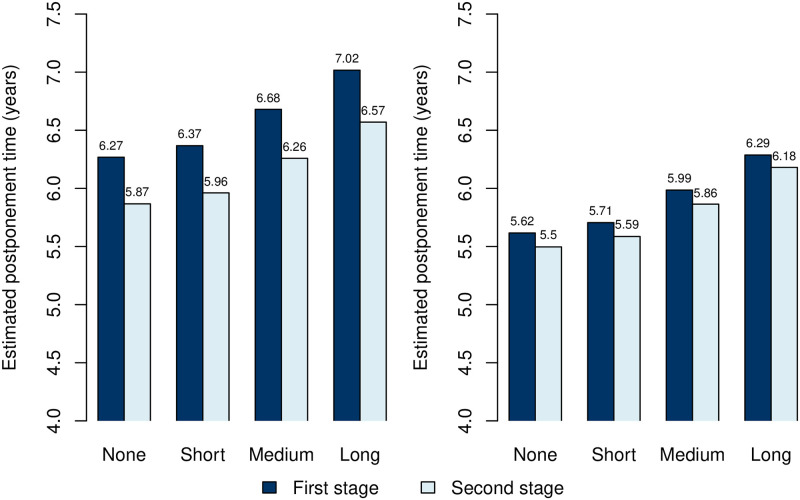
Fig 6. Estimated mean postponement times by educational attainment levels.
The figure presents the mean postponement time of the next chronic diagnosis given survival for retired males (left) and females (right) at various educational levels. Estimations are made starting from the most common triad of diagnoses heart disease, hypertension, and high cholesterol (see Fig 5). The second stage postponement times are a weighted average with weights determined by the transition probabilities of the first stage diagnoses.

