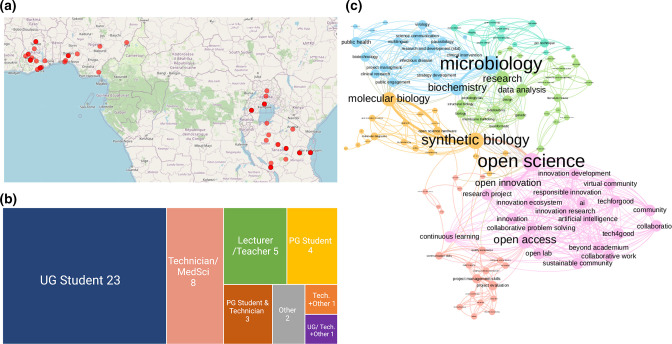
Fig. 3.
Location and profession of participants of virtual curriculum in Africa. (a) Locations derived from geocoded data from form input. All participants are shown as red dots by city. (b) A visualization of the professions who filled in the post-curriculum form. (c) Network of skills in the cohort of participants, taken information given upon signup to the JOGL platform. Skills are connected if a participant has both of them in their profile. The thickness of connections indicates number of participants sharing two skills and the size of nodes indicates the number of neighbouring nodes. Gephi 0.9.3(22) was used to represent the network, as described in Methods. Colour indicates the community, assessed using modularity.

