Figure 1.
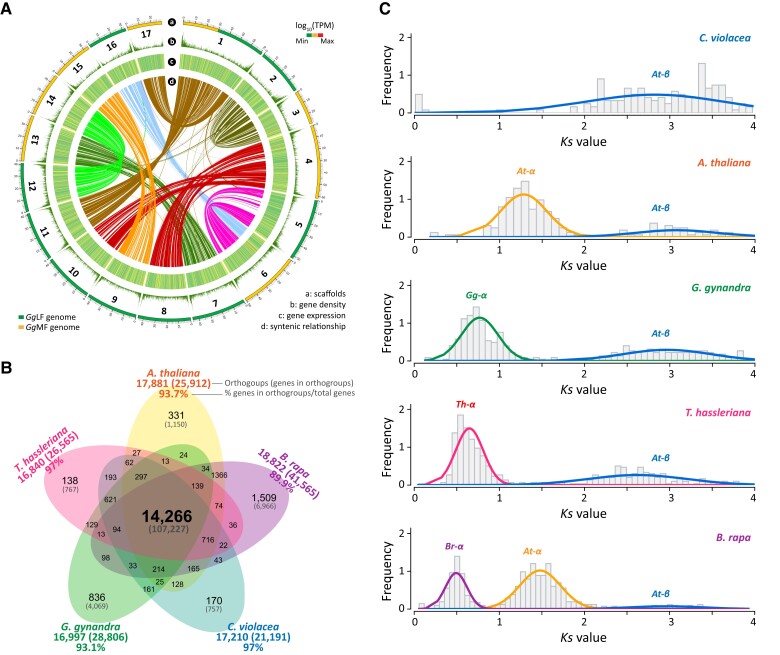
The genome sequence of G. gynandra, intraspecies synteny, gene orthogroup clustering, and whole-genome duplication events. A, Circos plot showing largest 17 pseudomolecules of the G. gynandra genome assembly (track a) including two subgenomes GgLF (green) and GgMF (yellow), gene density (track b), the expression level of the predicted gene models (track c), and intraspecies syntenic blocks (minspan = 4 genes) among the scaffolds analyzed by MCscan (track d). Gene densities were estimated by a window of 100 kb. Gene expression was calculated for each window of 100 kb, using leaf developmental (stages Leaf_0 to Leaf_5) transcriptome data from Külahoglu et al. (2014), quoted as log10(average TPM). Ribbon links in the inner track convey syntenic regions between two pseudomolecules and generally show a clear 2:2 syntenic pattern. Scaffold length is in Mb. B, Venn diagram illustrating the commonly shared and unique orthogroups from G. gynandra, C. violacea, T. hassleriana, A. thaliana, and B. rapa. Numbers in brackets denote the genes included in the orthogroups. Percentages were calculated based on the total genes annotated in each genome. C, Whole-genome duplication (WGD) events identified in different species by fitting the Ks distributions for WGD-derived gene pairs using Gaussian Mixture Models (GMMs). Ks peaks corresponding to At-β (commonly shared), At-α in A. thaliana and B. rapa, Gg-α in G. gynandra, Th-α in T. hassleriana and Br-α in B. rapa. Only Ks ≤ 4 were included in this analysis.

