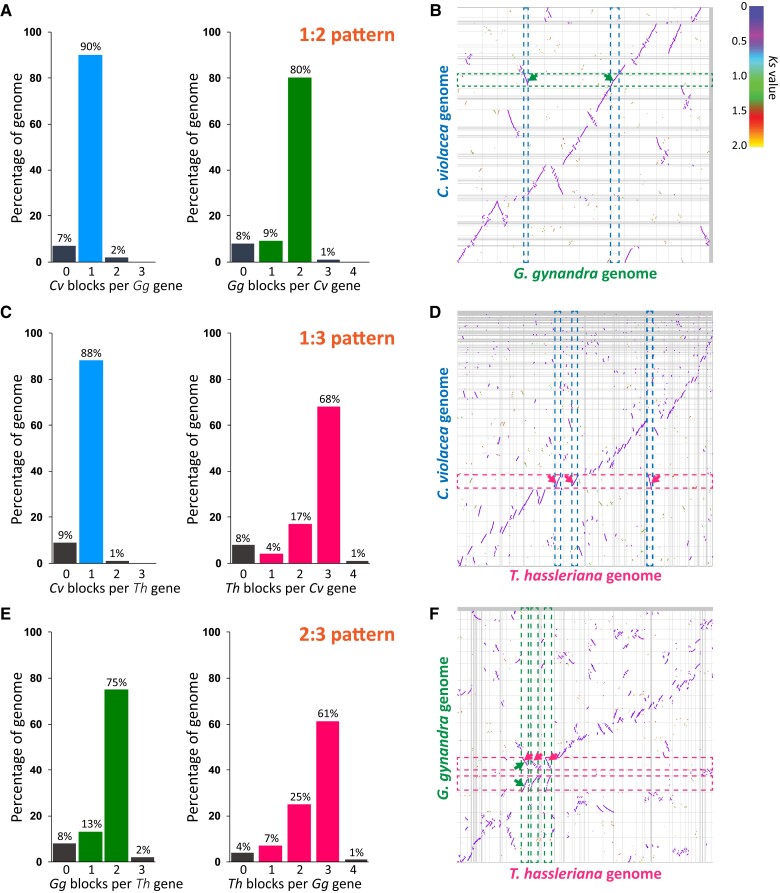
Figure 2.
Comparative genomics of three Cleomaceae genomes. A, Ratio of syntenic depth between C. violacea and G. gynandra. Syntenic blocks of C. violacea per G. gynandra gene (left) and syntenic blocks of G. gynandra per C. violacea gene are shown suggesting a clear 1:2 pattern. B, Macrosynteny of the C. violacea and G. gynandra genomes. Blue and green dashed bands and arrows point to examples showing one syntenic block found in the C. violacea genome and two respective syntenic blocks in the G. gynandra genome. C, Ratio of syntenic depth between C. violacea and T. hassleriana showing a clear 1:3 pattern. D, Macrosynteny of the C. violacea and T. hassleriana genomes. Blue and red dashed bands and arrows point to examples showing one syntenic block found in the C. violacea genome and three respective syntenic blocks in the T. hassleriana genome per C. violacea block, respectively. E, Ratio of syntenic depth between G. gynandra and T. hassleriana showing a clear 2:3 pattern. F, Macrosynteny of the G. gynandra and T. hassleriana genomes. Green and red dashed bands and arrows point to examples showing two syntenic blocks found in the G. gynandra genome and three respective syntenic blocks in the T. hassleriana genome per G. gynandra block, respectively. Horizontal and vertical gray lines separate scaffolds. (B, D, F) Syntenic blocks were colored based on the Ks values of syntenic gene pairs between genomes. Color scale is provided at the top right corner. The names of the scaffolds in each genome are not shown. For the comparative genomics between C. violacea and Brassicaceae (A. thaliana and B. rapa, syntenic ratios of 1:2 and 1:6, respectively), see Supplemental Figure 7.

