Figure 4.
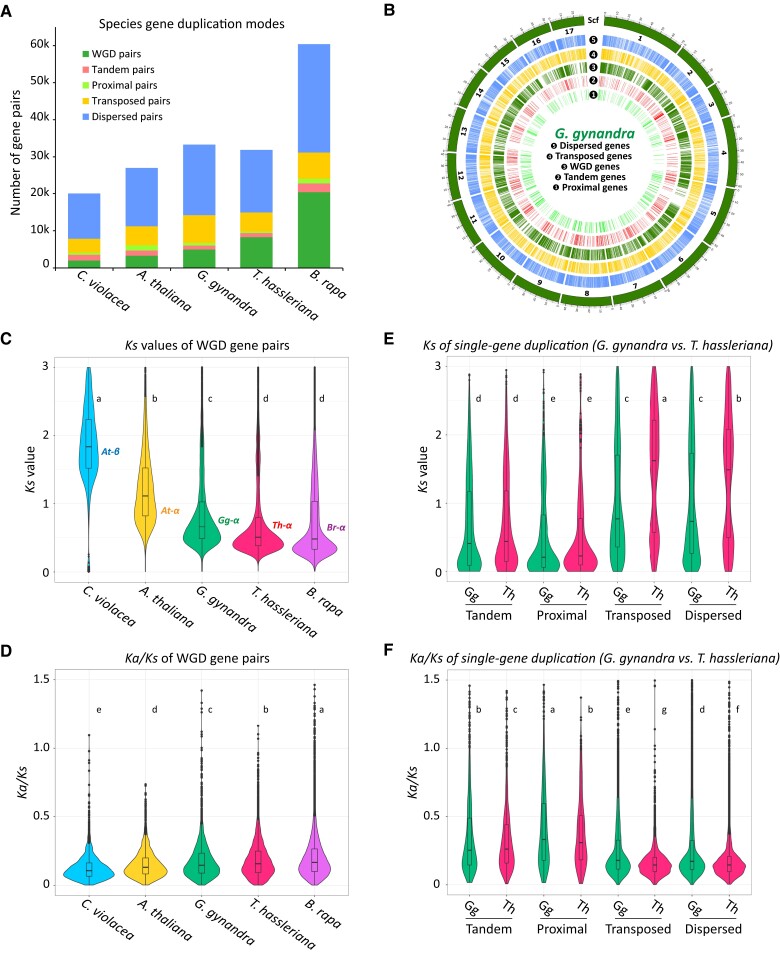
Different modes of gene duplication and evolutionary patterns of duplicated gene pairs in the G. gynandra and T. hassleriana genomes. A, Number of gene pairs originating from different modes of gene duplication in selected Brassicaceae and Cleomaceae genomes. Duplicated genes were identified within each genome using Nelumbo nucifera (the sacred lotus) as outgroup. For the number of genes identified for each mode of gene duplication, see Supplemental Figure 10. B, Distribution of duplicated genes of different modes in the G. gynandra genome. Only the 17 largest pseudomolecules are shown. Scaffold length is in Mb. C and D, Evolutionary patterns of WGD-derived gene pairs from C. violacea, A. thaliana, G. gynandra, T. hassleriana and B. rapa including Ks and Ka/Ks ratio distribution. E and F, Evolutionary patterns of single-gene-derived gene pairs from G. gynandra and T. hassleriana including Ks and Ka/Ks ratio distribution. Significance in (C–F) was based on one-way ANOVA (Fisher’s LSD post hoc test). Different letters indicate significant difference at P ≤ 0.05. Mean values are sorted alphabetically with “a” being the largest. For Ka plots, see Supplemental Figure S11.

