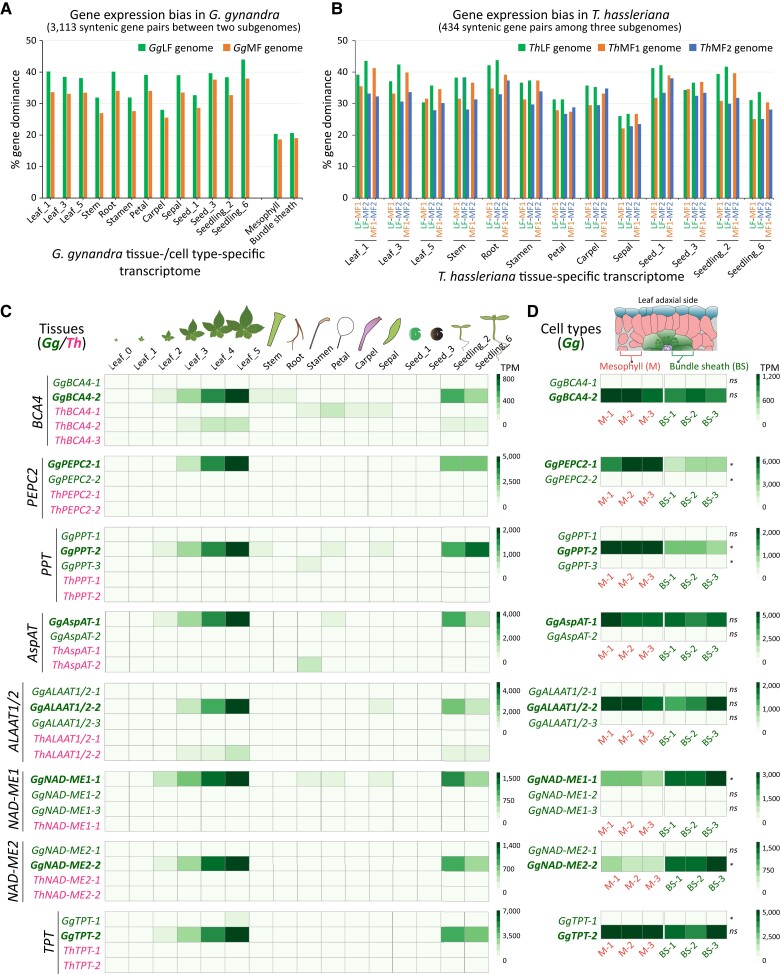
Figure 7.
Tissue- and cell type-specific gene expression analysis of subgenomes and genes from the C4 photosynthesis pathway. A, Subgenome gene expression bias in the G. gynandra genome based on a total 3,113 syntenic ohnologous gene pairs between the two subgenomes. Tissue- and cell type-specific transcriptome data were used to calculate gene expression bias. For each sample, gene expression was compared between each syntenic gene pairs. B, Subgenome gene expression bias in the T. hassleriana genome based on 434 syntenic ohnologous gene triads across the three Th-subgenomes. Only tissue-specific transcriptome data were used. For (A and B), paired tissue-specific data were derived from the same study (Külahoglu et al., 2014). Gene dominance between each syntenic ohnologous gene pair was determined by Student's two-sided t-test, P ≤ 0.05, n = 3. C, Tissue-specific gene expression analysis of key gene families in the C4 pathway, showing a high expression level of one Gg duplicated gene copy compared to other copies found in two species for each gene family. These gene copies with elevated gene expression were also expressed highly in the cell type-specific transcriptome data (D) and displayed a preferential expression pattern in mesophyll or bundle sheath cells, or equally high expression in both samples for those localized in both cell types. A subset of 13 samples was used in (A) and (B), while a subset of 16 samples was included in (C), from the total of 18 original samples (Külahoglu et al., 2014). For (A–C), mean values of three replicates were used per sample. For (D), data from three replicates are presented. Significance was calculated for means between two cell types for each gene using Student's two-sided t-test. Ns: nonsignificant. *Significant at P ≤ 0.05. For other C4 genes, see Supplemental Data Set 5.

