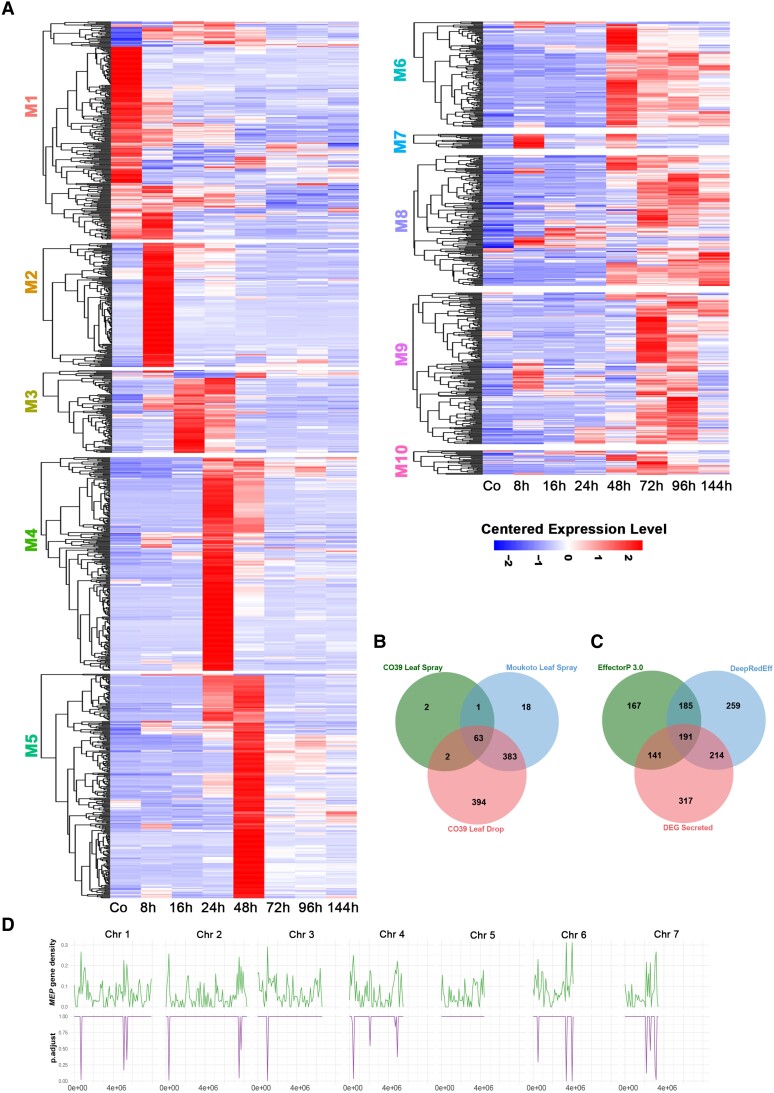
Figure 3.
Stage-specific temporal expression of the M. oryzae secretome during rice infection. A) Heat map showing the hierarchical clustering of pathogen genes encoding putatively secreted proteins from each WGCNA co-expression module. Distinct temporal patterns of secretome expression occur during biotrophic and necrotrophic development. Expression levels are shown relative to the mean expression TPM value across all stages. B) Venn diagram showing a comparison of differentially expressed secreted protein-encoding genes from 3 different inoculation experiments (CO39 Leaf Spray, Moukoto Leaf Spray, and CO39 Leaf Drop Infections). In total, 68 effector candidates were identified from the CO39 leaf spray infections, 467 effector candidates from Moukoto leaf spray inoculation, and 847 effector candidates from CO39 leaf drop infections. Although leaf drop-CO39 infections revealed expression of many more differentially expressed effector candidates, 20 effector candidates were revealed only in spray inoculation experiments. C) Comparison of effector predictions of host-induced secreted proteins using EffectorP 3.0 and DeepRedEff algorithms with differentially expressed genes encoding signal peptide-containing proteins (DEG Secreted). D) Enrichment analysis of MEP gene loci on M. oryzae chromosomes 1–7, encoding predicted secreted proteins. The number of MEP genes was compared with the total gene number in 200 kb windows across each chromosome. Phyper was used to compute the hypergeometric distribution and obtain P-values (Johnson et al. 1992). The resulting graphs in the bottom panel show regions of each chromosome where there is a significant over-representation of MEP gene loci.

