Figure 2:

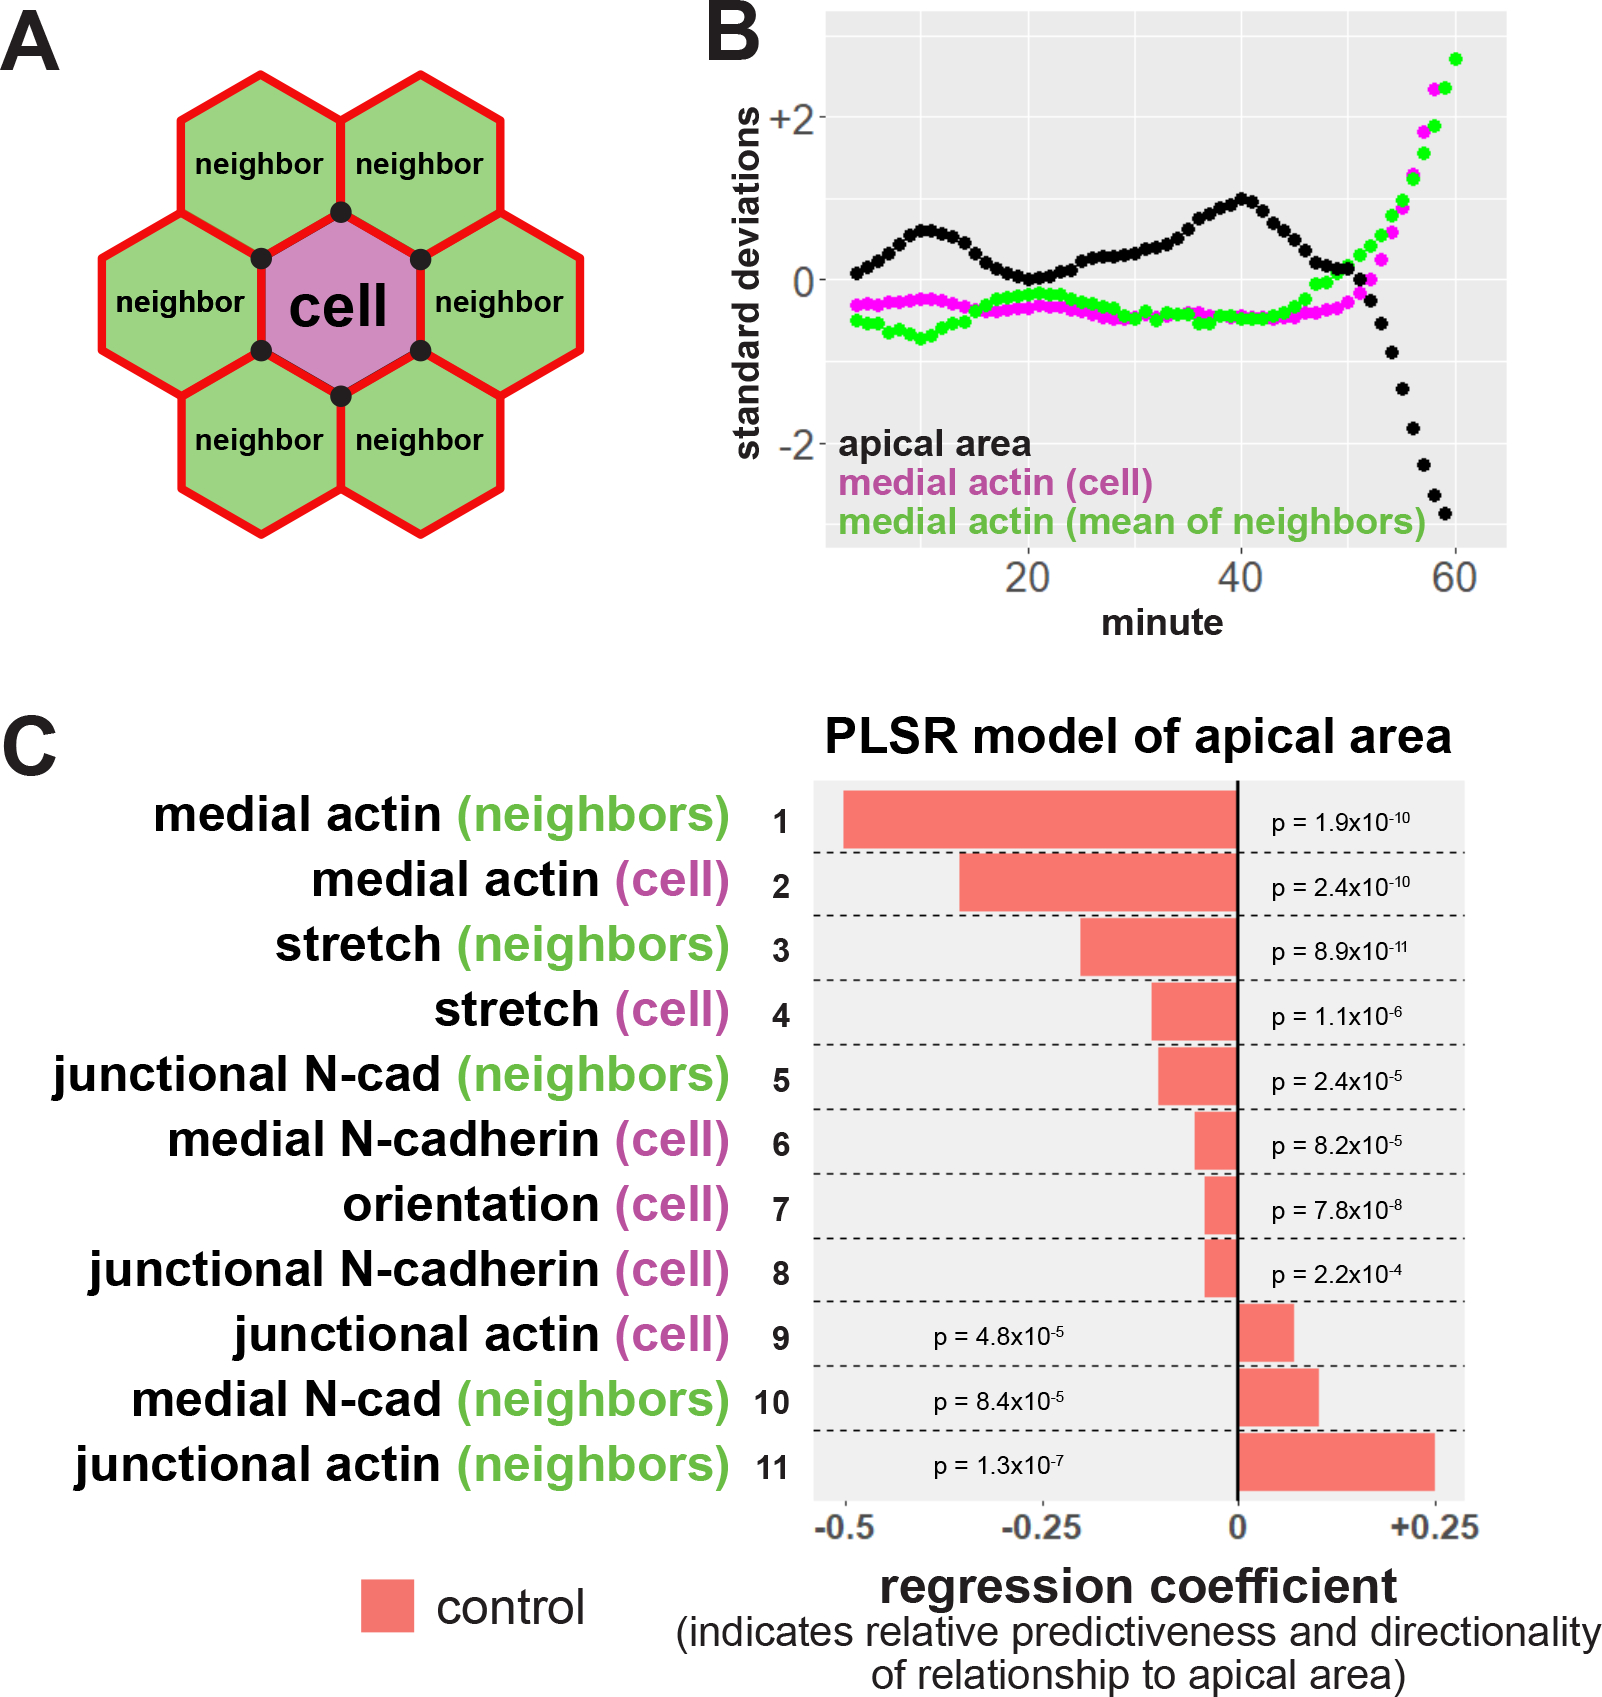
Neighbor analysis and partial least squares regression reveal multiple modes of non-cell autonomous feedback on apical constriction. A, diagram of neighbor analyses. Neighbor relationships in each frame are determined by sharing of at least one cell vertex, represented by black circles. Average values for the neighbors of each cell were then calculated. B, sample track of a cell and its neighbors. Apical area is shown in black, mean medial actin localization within the cell in magenta, and mean medial actin of neighboring cells shown in green. s.d. = standard deviations. C, partial least squares regression (PLSR) of apical area in control cells in the anterior neural ectoderm indicates non-cell autonomous control of apical constriction. Regression coefficients represent the independent effect of each variable on apical surface area. P-values for each regression component were calculated via jackknife resampling included in the R pls package.
