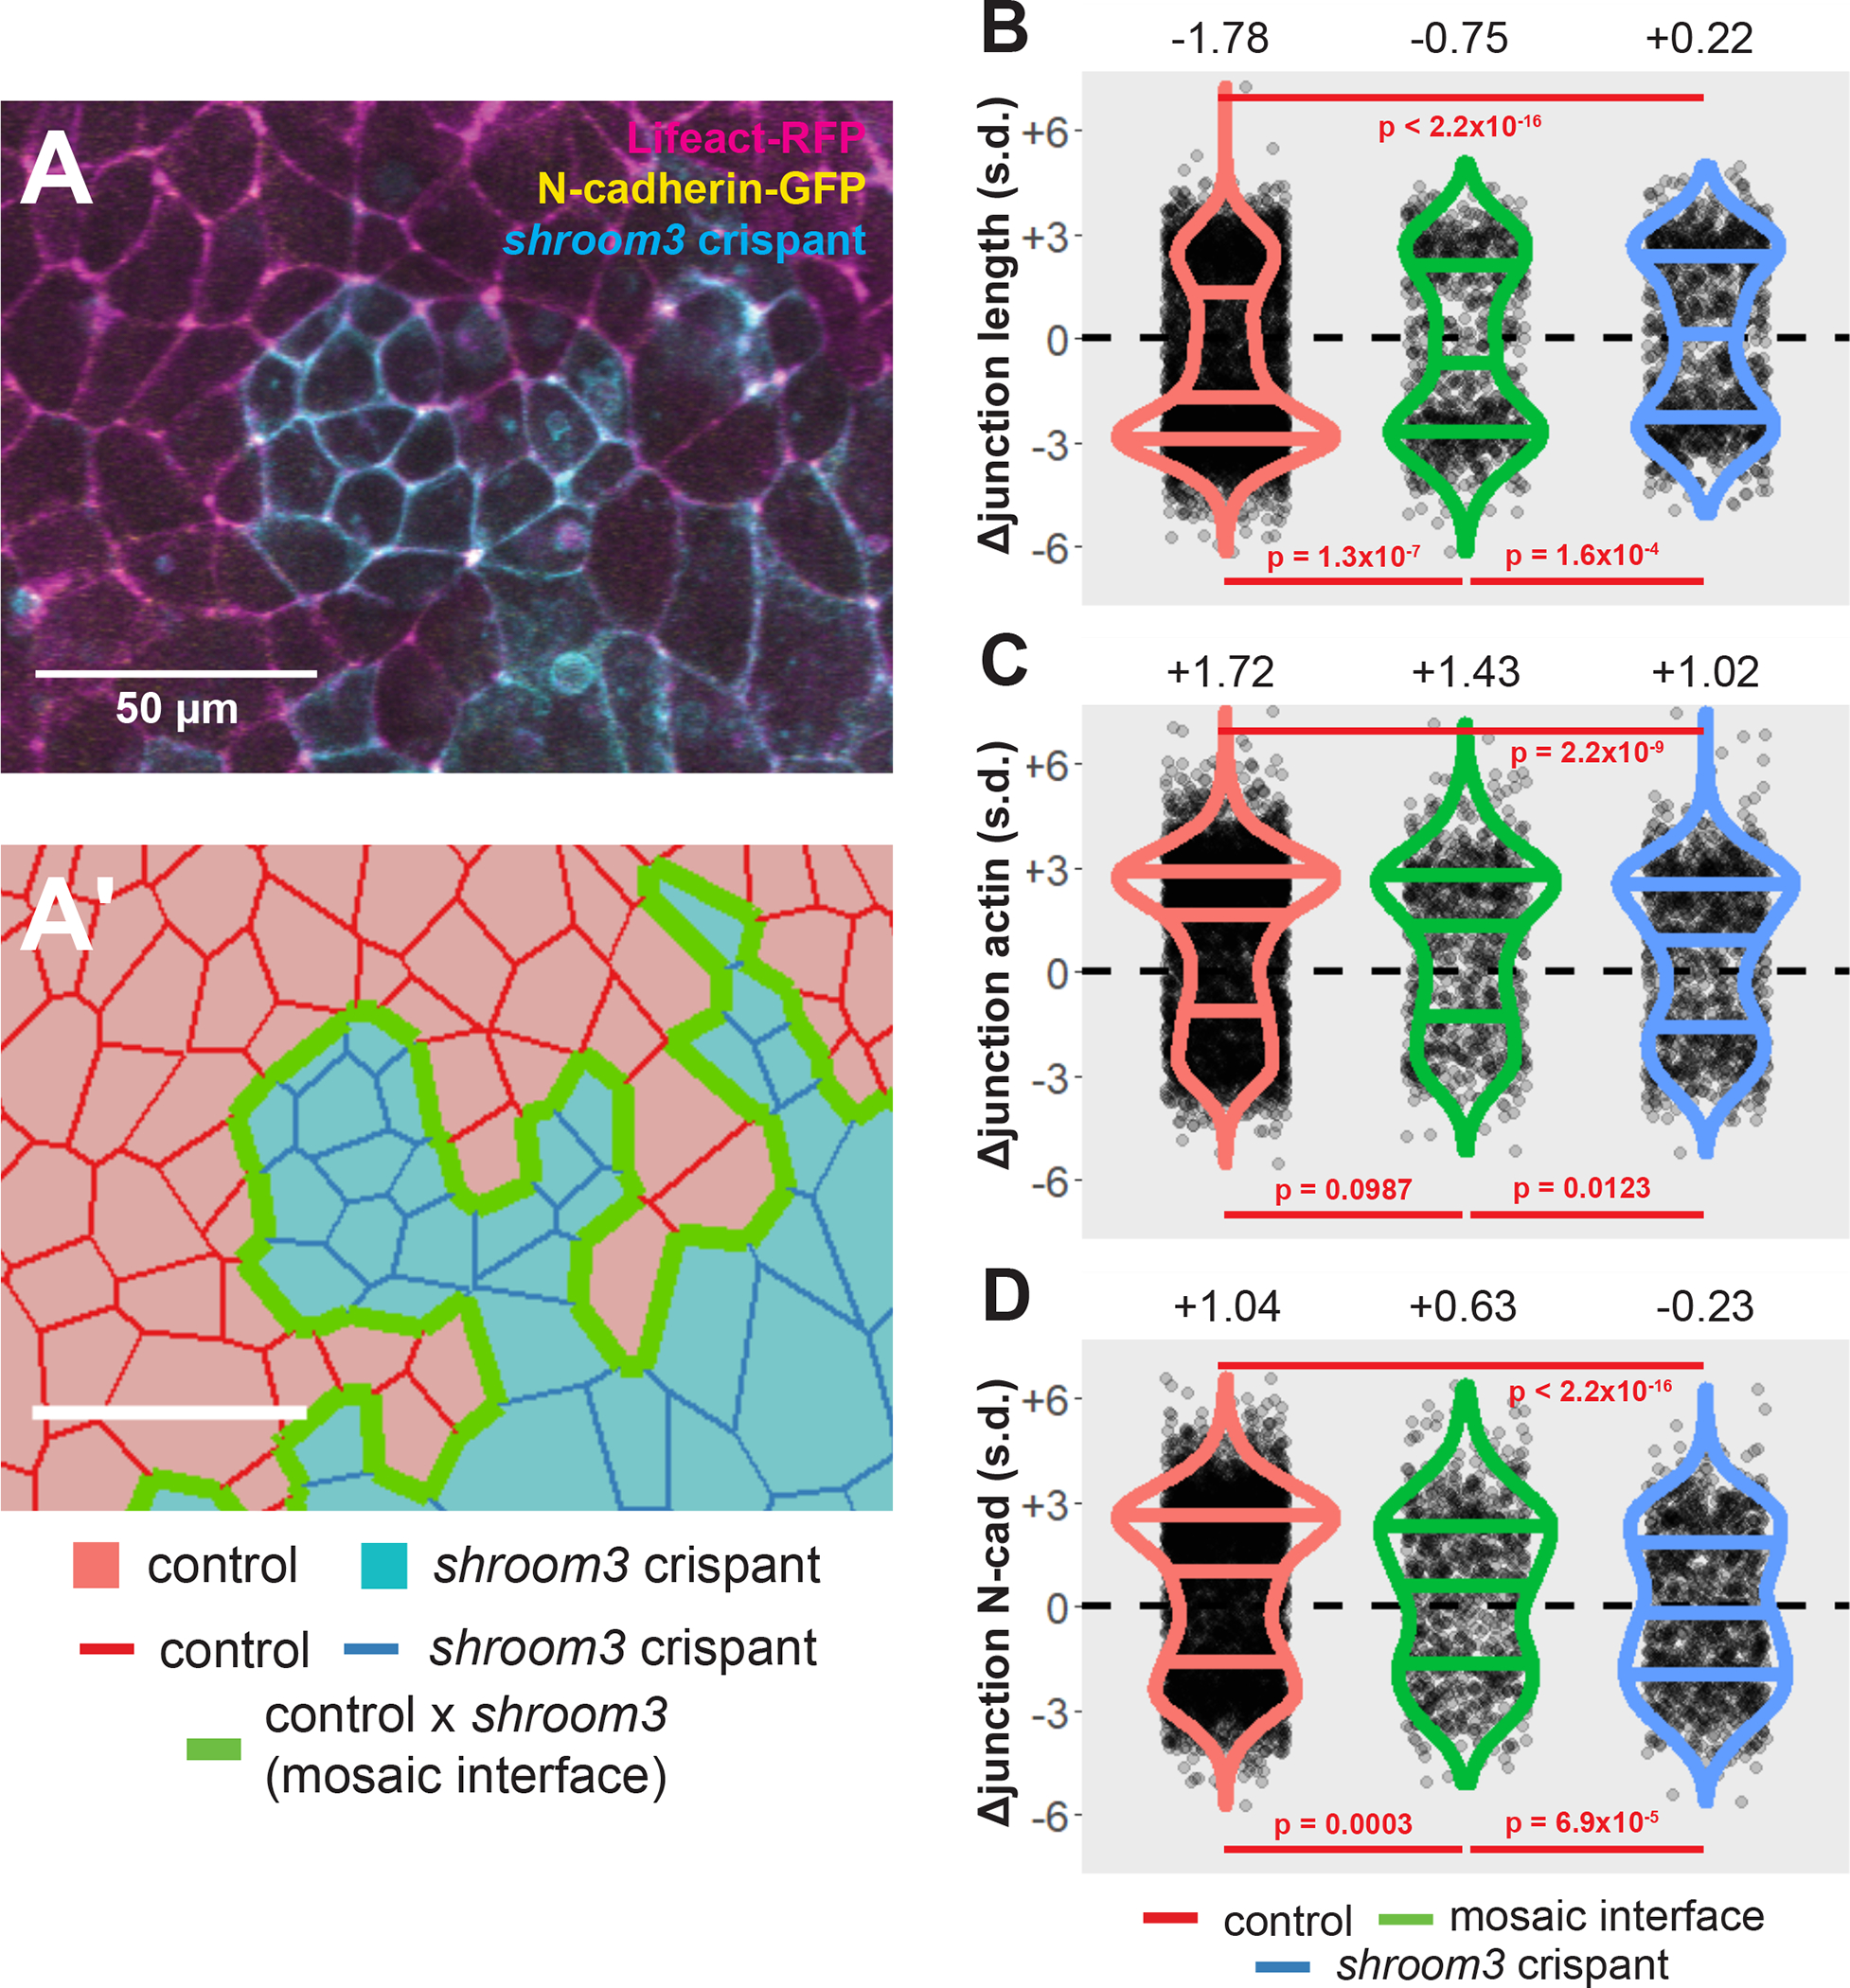
Figure 3:

Loss of Shroom3 disrupts junction behaviors along the mosaic interface. A, control and shroom3 crispant cells meet at the mosaic interface. Magenta = Lifeact-RFP/actin, green = N-cadherin-GFP, cyan = membrane(CAAX)-BFP + Cas9 protein (PNA Bio) + shroom3-targeted sgRNA. Scale bar = 50μm. A’, cell tracking can automatically identify cell junctions at the mosaic interface. Red cells = control cells, blue cells = shroom3 crispant cells. Red junctions = control x control interaction, green junctions = control x shroom3 crispant interaction (mosaic interface), blue junctions = shroom3 crispant x shroom3 crispant interactions. Scale bar = 50μm. B, C, D, overall change in junction length, mean junctional actin, and mean junctional N-cadherin in control, mosaic interface, and shroom3 crispant junctions. Both constriction and N-cadherin accumulation are significantly disrupted in interface junctions. Each dot is an individual junction. Horizontal lines within each violin delineate quartiles along each distribution. s.d. = standard deviations. Median value in each group is listed at the top of the panel. P-values were calculated via KS test.
