Figure 5:

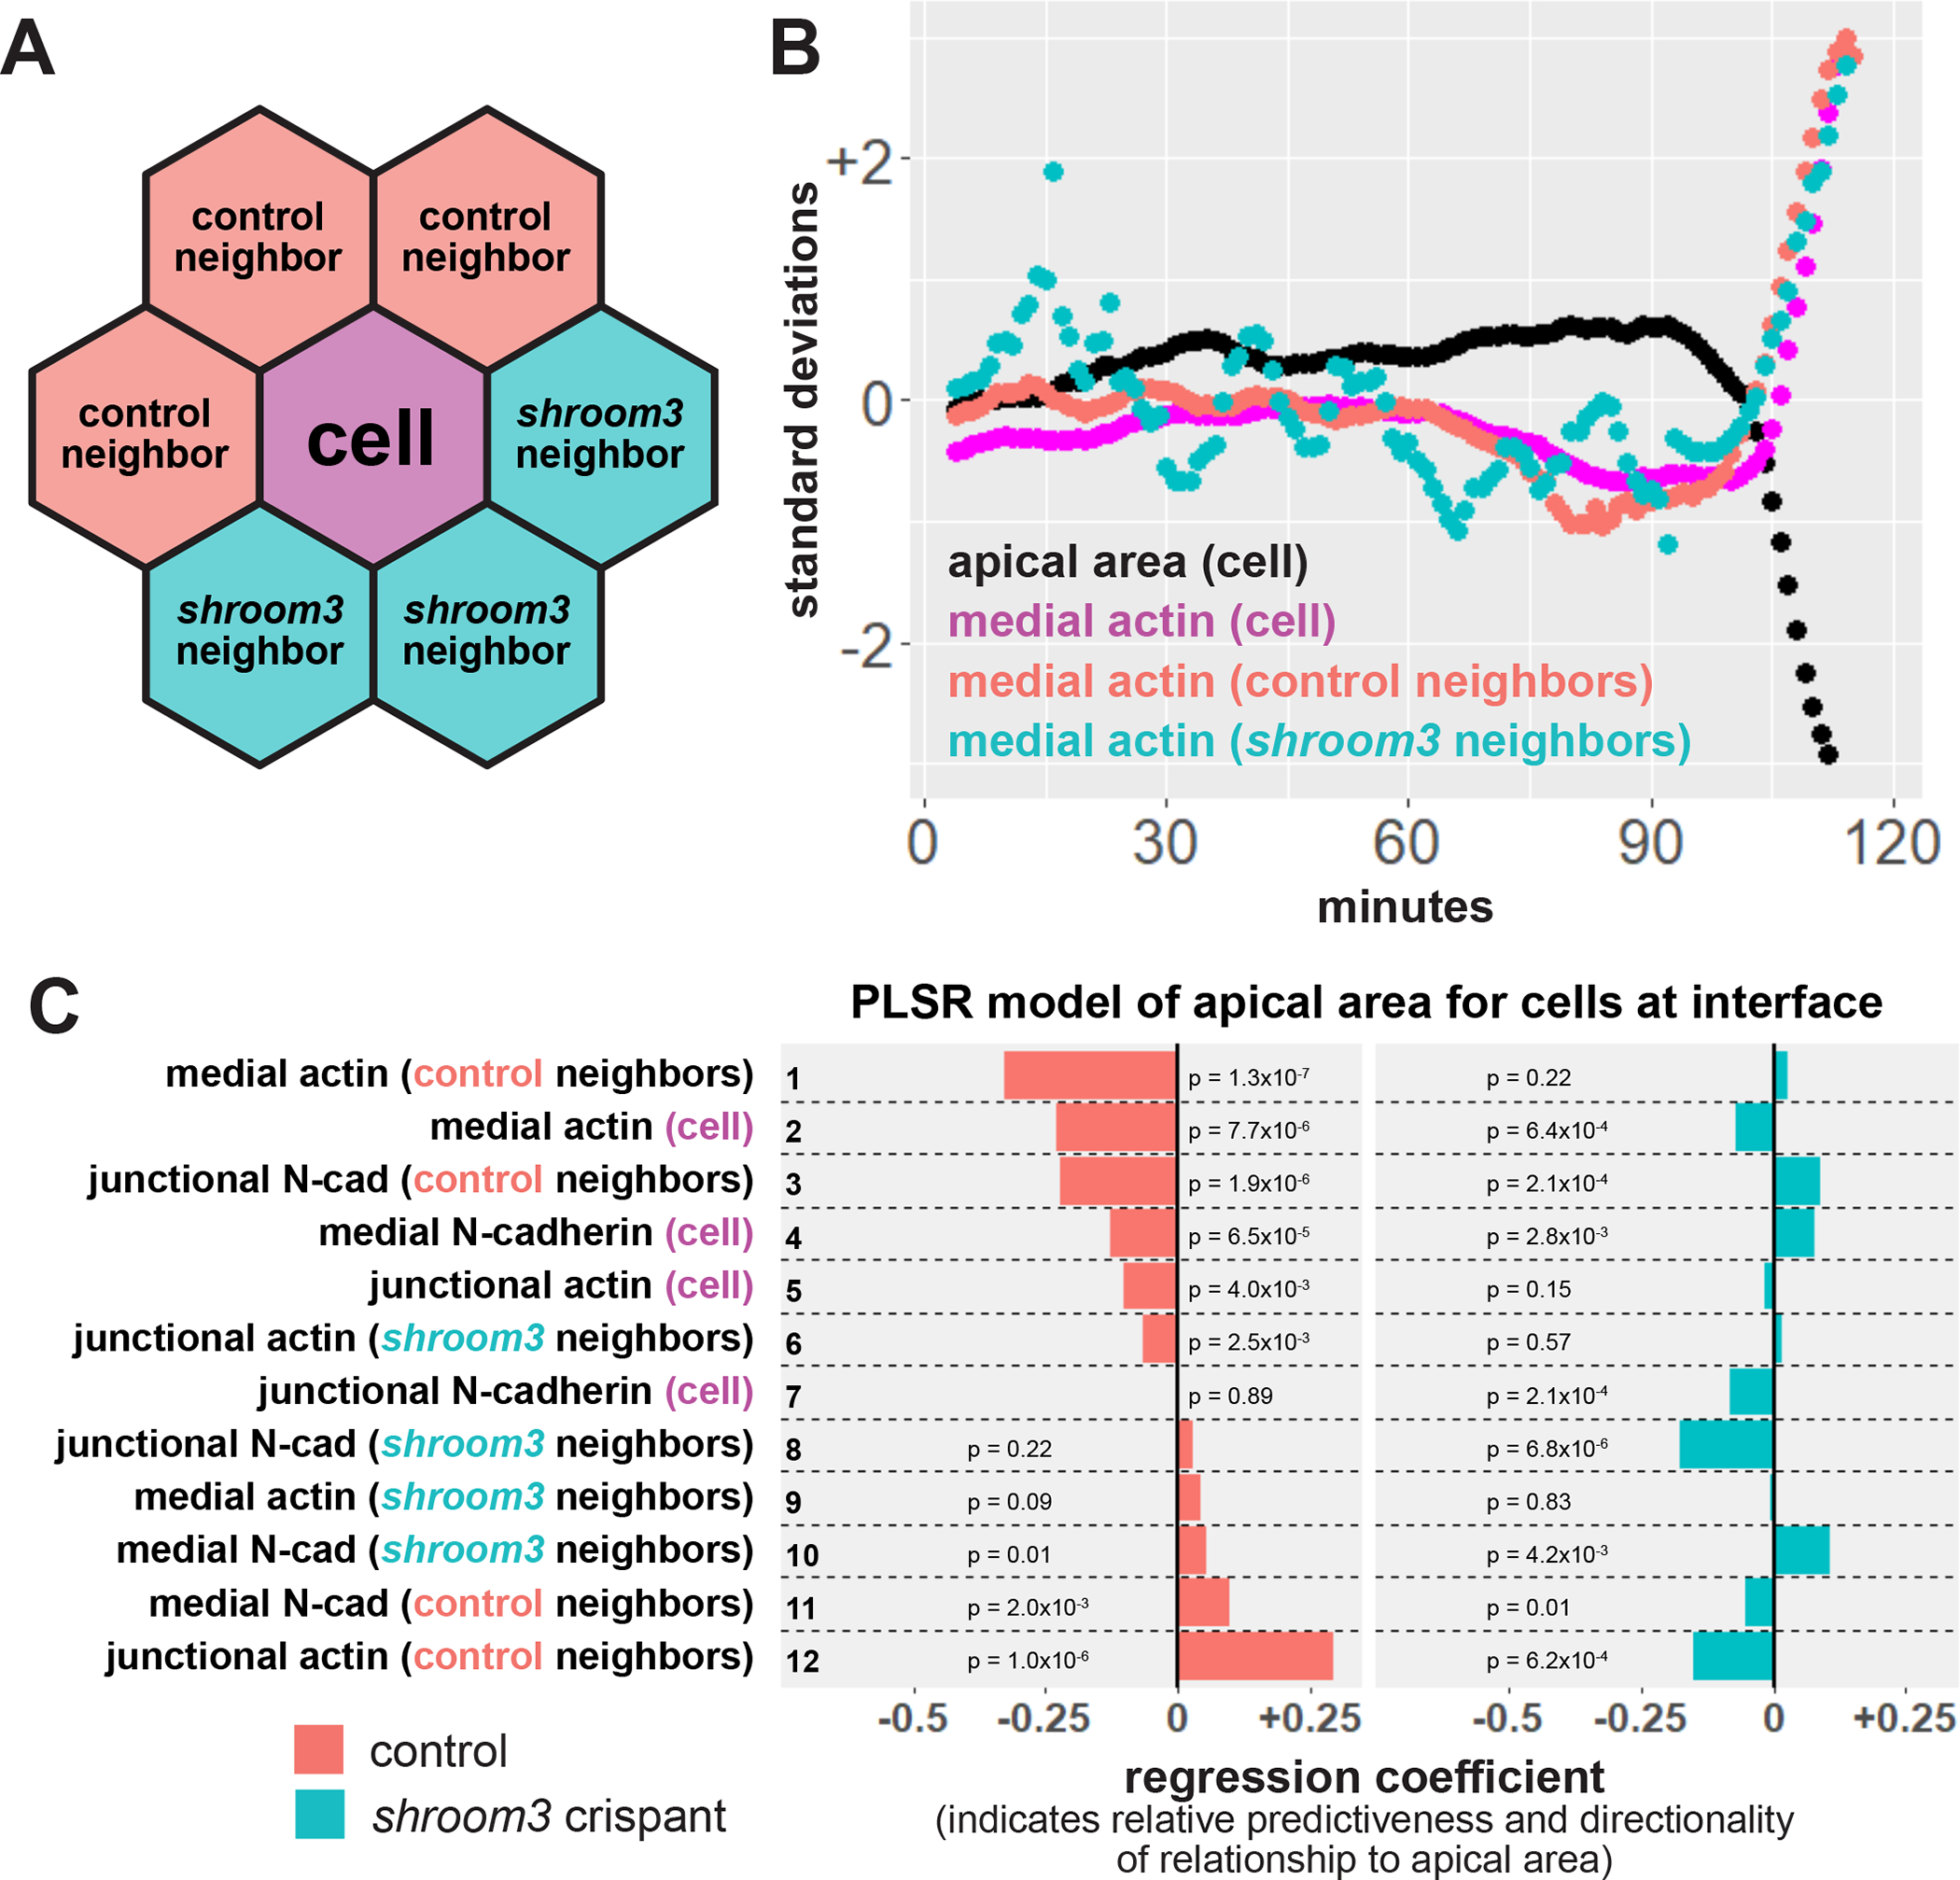
Loss of Shroom3 disrupts non-cell autonomous effects of actin localization. A, schematic of neighbor analysis of cells along the mosaic interface. Mean behaviors of both control and shroom3 crispant neighbors can be calculated separately. B, sample cell track showing the behavior of one control cell at the mosaic interface and its neighbors. Black = apical area of cell, magenta = mean medial actin of cell, red = mean medial actin of control neighbors, blue = mean medial actin of shroom3 crispant neighbors. C, partial least squares regression (PLSR) of apical area in both control and shroom3 crispant cells along the mosaic interface. Protein localization variables on the right indicate whether the resulting coefficient was generated based on influence of the variable within a cell, from a cell’s control neighbors, or a cell’s shroom3 crispant neighbors. Regression coefficients show the influence of each variable on apical area in both control cells (red bars) and shroom3 crispant cells (blue bars). P-values for each regression component were calculated via jackknife resampling included in the R pls package.
