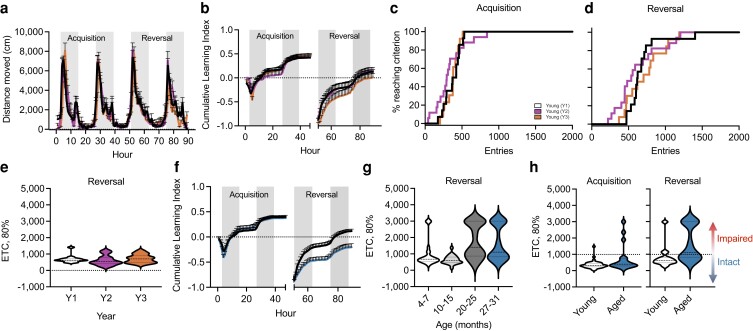
Fig. 1.
Assessment using the PhenoTyper demonstrating reproducibility over time and increasing cognitive heterogeneity with age. a) Circadian activity (distance moved) plotted per hour over a 90-h testing period in the PhenoTyper of young C57BL/6N male mice (4–7 months) cohorts assessed over a 3-year period (Y1-Y3). Shaded regions indicate dark periods of the light/dark cycle. b) Plotted cumulative learning index by year during initial learning (acquisition; 0–49 h) and reversal (49–89 h) phases show comparable performance across young cohorts. c and d) Percentage of mice reaching criterion based on correct entries during the acquisition (c) and reversal (d) phases of the behavioral task. e) Violin plots depicting the number of entries to achieve 80% criterion during the reversal phase were comparable among young cohorts across years. f) Plotted cumulative learning index of young (black) and aged (27–31 months; blue) animals depict age-related separation between groups during the reversal phase. g) Violin plots depicting the number of entries to achieve 80% criterion show increasing stratification within aged (20–25 months, 27–31 months; n = 27, n = 35) cohorts during the reversal phase compared to young (4–7 months; n = 24) and middle-aged (10–15 months; n = 22) mice. h) Violin plots depicting the number of entries required to achieve 80% criterion by young and aged (27–31 months) during the acquisition and reversal phases. Based on young performance metrics (90% confidence interval), aged animals were subsequently stratified into intact (<1,000 entries) and impaired (>1,000 entries) subgroups. For graphs a–e), colors represent the following: Y1 cohort (black/white, n = 14), Y2 cohort (purple, n = 17), and Y3 cohort (orange, n = 13). For graphs f) and h), colors represent the following: young (black, n = 40) and aged (blue, n = 35). Error bars depict the mean ± SEM.

