Fig. 4.
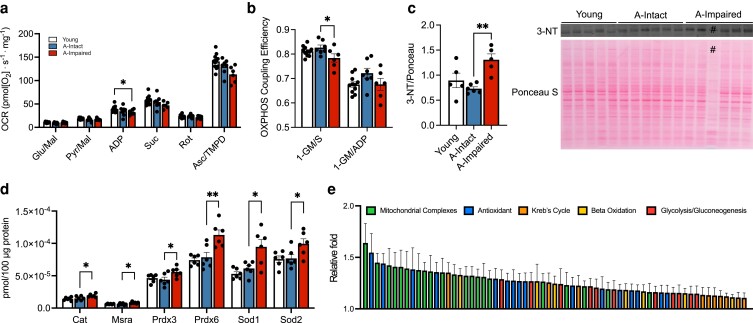
Cognitive stratification reveals mitochondrial dysfunction and readouts of oxidative stress in aged–impaired hippocampus. a) Bar plots depicting the OCR in hippocampal tissue extracted from young (n = 11), aged–intact (n = 7), and aged–impaired (n = 6) animals in response to the substrates glutamate/malate (Glu/Mal), pyruvate/malate (Pyr/Mal), ADP (2,500 µm; P = 0.0138), succinate, rotenone, and ascorbate/TMPD. b) OXPHOS coupling efficiency (1-GM/S) as significantly reduced (P = 0.0297) in the aged–impaired group relative the aged–intact animals. c) Western blot quantification of the oxidative stress marker 3-NT normalized to total protein is significantly increased in aged–impaired animals (n = 5) compared to young (n = 5) and aged–intact (n = 6) groups (P = 0.003). # was excluded due to technical inconsistency in total protein levels. d) Bar graphs depicting quantification of the following antioxidant proteins with increased expression in the aged–impaired animals relative to the aged–intact group (n = 6/group): catalase (P = 0.0449), methionine sulfoxide reductase (P = 0.0173), peroxiredoxin 3 (P = 0.0429), peroxiredoxin 6 (P = 0.0037), superoxide dismutase 1 (P = 0.0105), and superoxide dismutase 2 (P = 0.0443). e) Bar graphs depicting the relative fold (aged–impaired over aged–intact) increases of mitochondrial complex (green), antioxidant (blue), Kreb's cycle (orange), β-oxidation (yellow), and glycolysis/gluconeogenesis (red) proteins quantified via targeted proteomic mass spectrometry analysis (see Tables S1–S6). For graphs a–d), colors represent the following: young (white), aged–intact (blue), and aged–impaired (red). Error bars depict the mean ± SEM. Significance was tested using one-way ANOVA (*P < 0.05; **P < 0.01).

