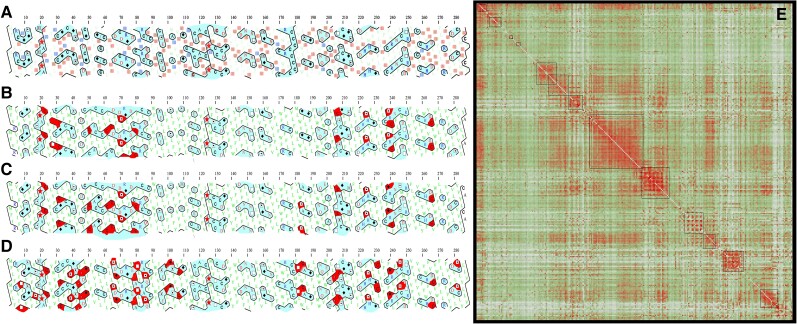
Fig. 7.
Restricted hydrophobicity loss in COX3 after losing pan-editing. (A) HCA for T. brucei. Light blue regions represent hydrophilic clusters, whereas pink squares highlight amino acids under purifying selection (P < 0.05), and blue squares indicate amino acids that show substitutions by hydrophobic ones in other kinetoplastids that have lost editing in COX3. (B) HCA for L. tarentolae highlighting in red hydrophilic amino acid positions that are hydrophobic in T. brucei. (C) HCA for C. fasciculata. (D) HCA for A. deanei. (E) Heatmap showing COX3 correlation of evolutionary changes between different amino acids by using Coeviz2. The scale goes from green = 0 (low correlation) to red = 1 (high correlation). Red squares on the diagonal of the heatmap are expected for local coevolution of the amino acids.

