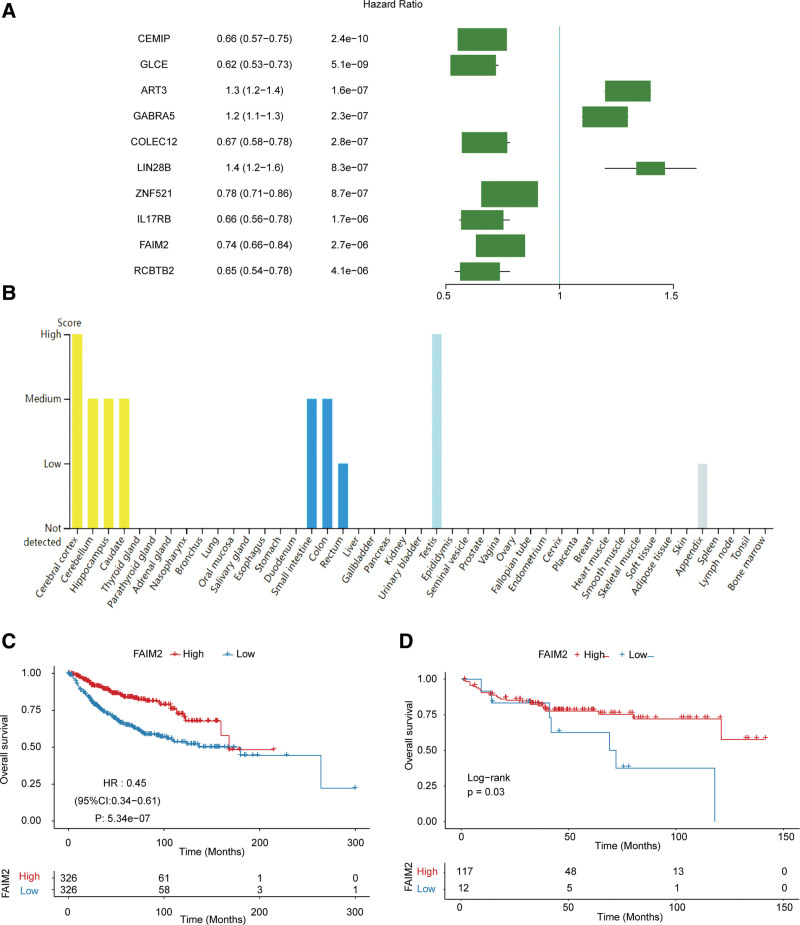
Figure 2.
FAIM2 was closely associated with the prognosis of MB. (A) The univariate Cox regression analysis results of DEGs. (B) Expression of FAIM2 in different tissues. The Kaplan–Meier curves of FAIM2 high and low expression groups in GSE124814. (C) And GSE202043. (D) Datasets. DEGs = differentially expressed genes. FAIM2 = Fas apoptotic inhibitory molecule 2, MB = medulloblastoma.

