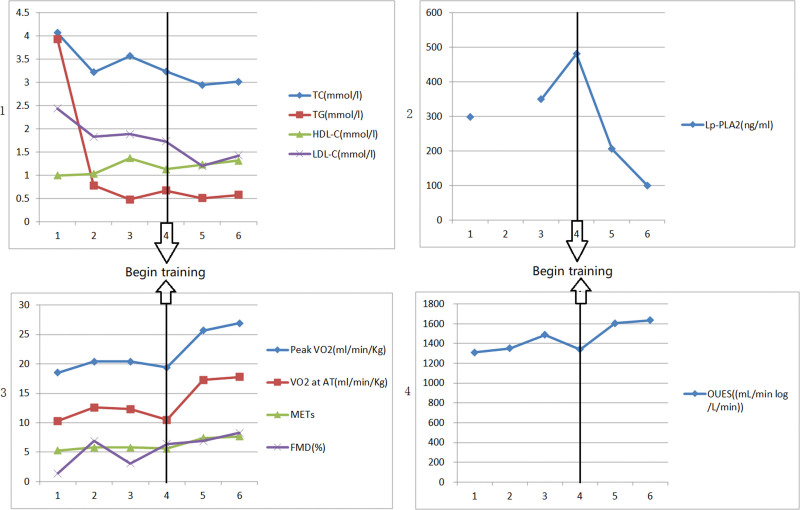
Figure 4.
The line chart of the patient’s all indicators.
The horizontal axis 1 = the first PCI preoperatively, 2 = 1 month after the first PCI, 3 = 3 months after the first PCI and the second PCI preoperatively, 4 = 3 months after the second PCI, 5 = 6 months after the second PCI, 6 = 1 year after the second PCI. FMD = flow-mediated vasodilation, HDL-C = high-density lipoprotein cholesterol, LDL-C = low-density lipoprotein cholesterol, LP-PLA2 = lipoprotein-associated phospholipase A2, Mets = metabolic equivalents, OUES = oxygen uptake efficiency slope, Peak VO2 = peak oxygen consumption, PCI = percutaneous coronary intervention, TC = total cholesterol, TG = three acyl glycerin, VO2 at AT = oxygen consumption at anaerobic threshold.

