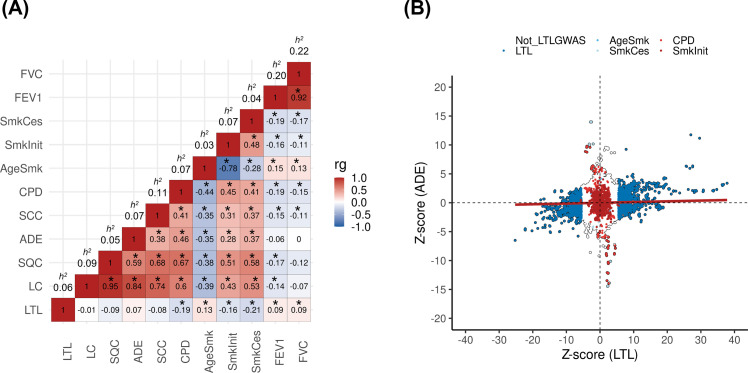
Figure 1. Genetic correlations between leukocyte telomere length (LTL) and lung cancer (LC) related traits.
(A) Heatmap representing the genetic correlation analyses (rg) for LTL across LC, histological subtypes (lung adenocarcinoma [ADE], squamous cell carcinoma [SQC], and small-cell carcinoma [SCC]), smoking propensity (cigarettes per day [CPD], smoking cessation [SmkCes], Smoking initiation [SmkInit], and age of smoking initiation [AgeSmk]), and lung function related (forced vital capacity [FVC] and forced expiratory volume [FEV1]) traits. The black star indicates correlations that passed Bonferroni correction (p<4x10–04). Heritability (h2) as the proportion of the phenotypic variance caused by SNPs. (B) Plot of Z-scores (ADE versus LTL), restricting to the Hapmap SNPs (~1.2 million) but excluding HLA region. Genome-wide significant SNPs (p<5x10–08) for each trait were coloured (CPD in red, SmkInit in dark red, LTL in dark blue, AgeSmk in blue, SmkCes in lightblue, and not genome-wide hits for LTL or any other selected trait in white). Linear regression line was coloured in red.


