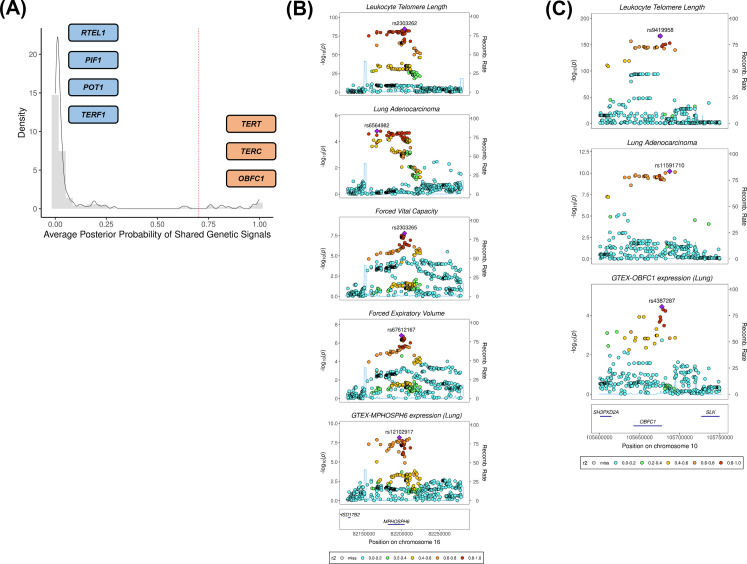
Figure 3. Colocalisation analyses for the genetic loci defined by the 144 leukocyte telomere length (LTL) variants.
(A) Distribution of the average posterior probability for shared genetic loci between LTL and lung adenocarcinoma, highlighting in orange the telomere maintenance loci that colocalised (avg_PP4≥0.70) and in blue the ones where there was limited evidence for colocalisation (avg_PP4<0.70). Dashed red line represents the arbitrary avg_PP4 cutoff of 0.70. Representative stack plots for the multi-trait colocalisation results within (B) MPHOSPH6 and (C) OBFC1 loci, centred on a 150 kb LD window of rs2303262 and rs9419958 variants, respectively. Left Y-axis represents the –log10(p-values) of the association in the respective genome-wide association study for a given trait. The right Y-axis represents the recombination rate for the genetic loci. The X-axis represents the chromosome position. SNPs are coloured by the linkage disequilibrium correlation threshold (r2) with the query labelled SNP in European population. Sentinel SNPs within the defined LD window were labelled in each trait.


