
Fig. 4. PD-L1-binding CDP screening and binding behavior.
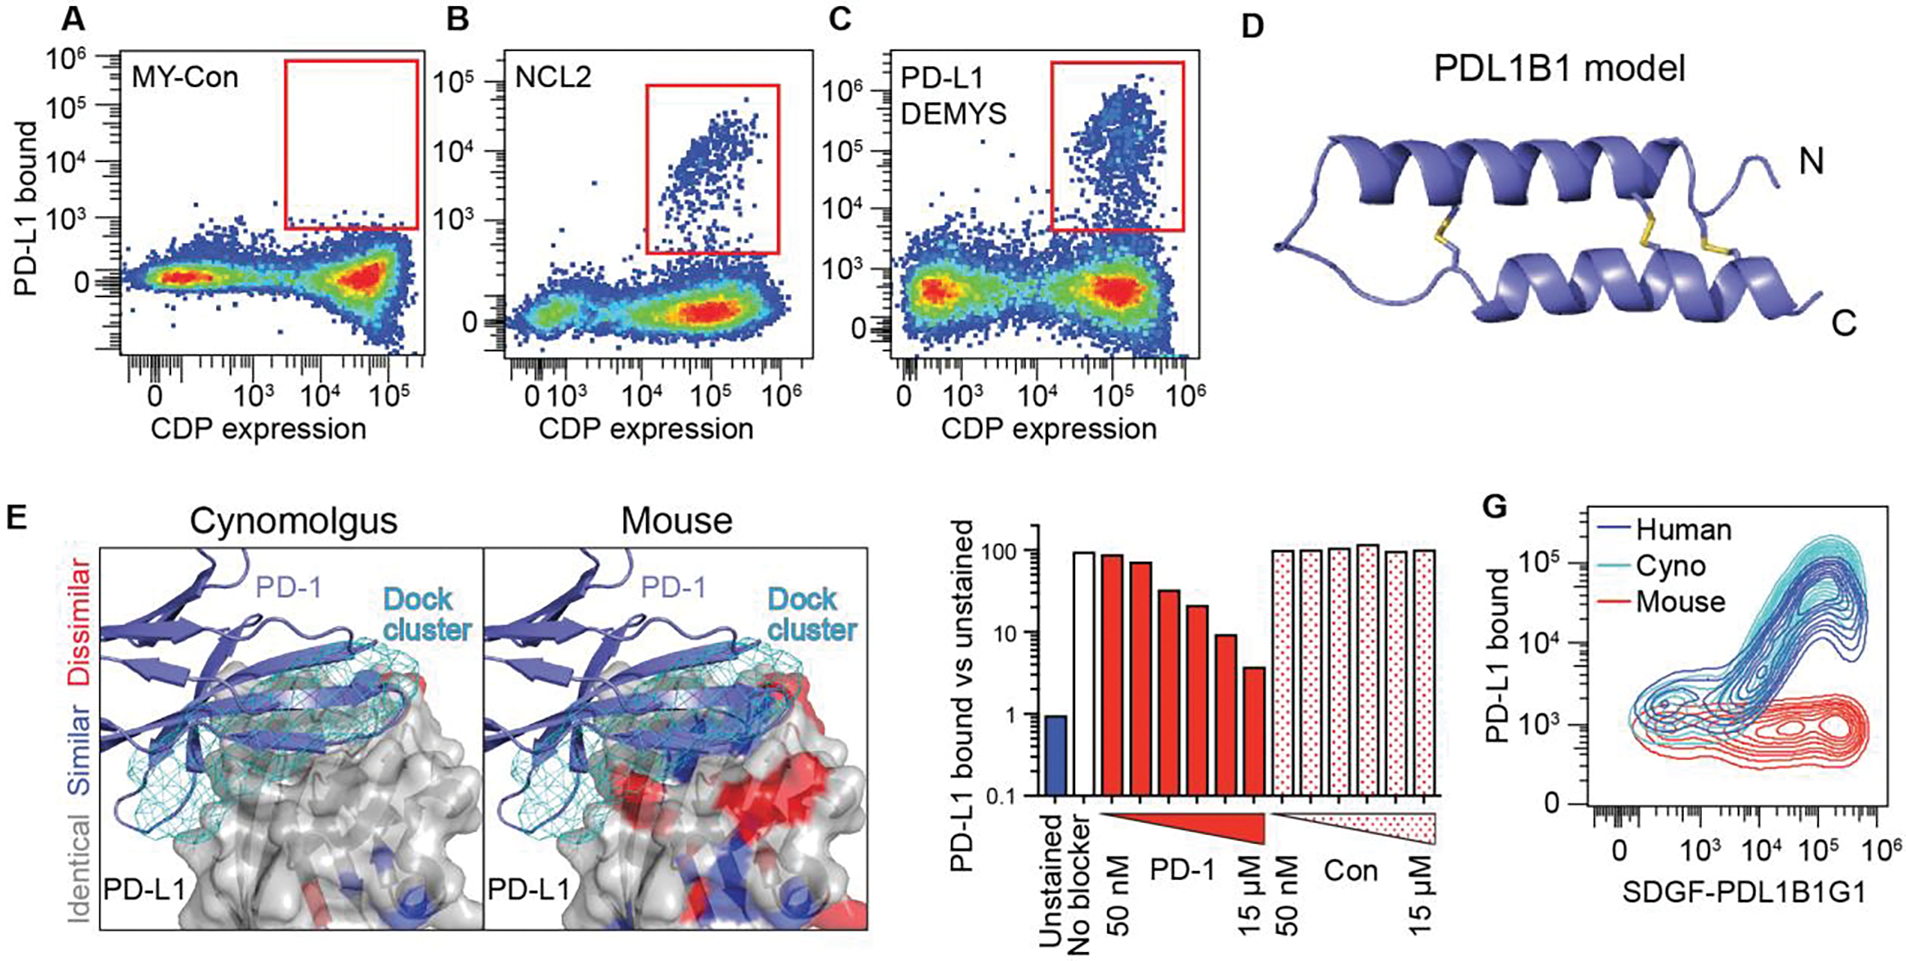
(A to C) Flow profiles after one magnetic sort and two flow sorts (100 nM PD-L1; flow included 100 nM streptavidin-AlexaFluor 647) to enrich for SDGF-displayed PD-L1 binding CDPs in MY-Con (A), NCL2 (B) and PD-L1 DEMYS (C). NCL2 yielded a single hit and DEMYS screening yielded four. (D) Ribbon model of the parental scaffold of PDL1B1 (PD-L1 binder 1). (E) PD-L1 DEMYS scaffold docking sites (top 200, cyan mesh) on human PD-L1, color-coded for cynomolgus monkey (left) and mouse (right) homology (white, identical residues; blue, similar; red, dissimilar). Ribbon structure is PD-1 bound to PD-L1 (PDB 4ZQK). (F) SDGF-PDL1B1G1:PD-L1 staining with or without PD-1-Fc competitor (“PD-1”) or control Fc fusion (“Con”) at 50 nM, 150 nM, 500 nM, 1.5 μM, 5 μM, or 15 μM. (G) SDGF-PDL1B1G1-expressing cells stained with human, cynomolgus, or mouse PD-L1.