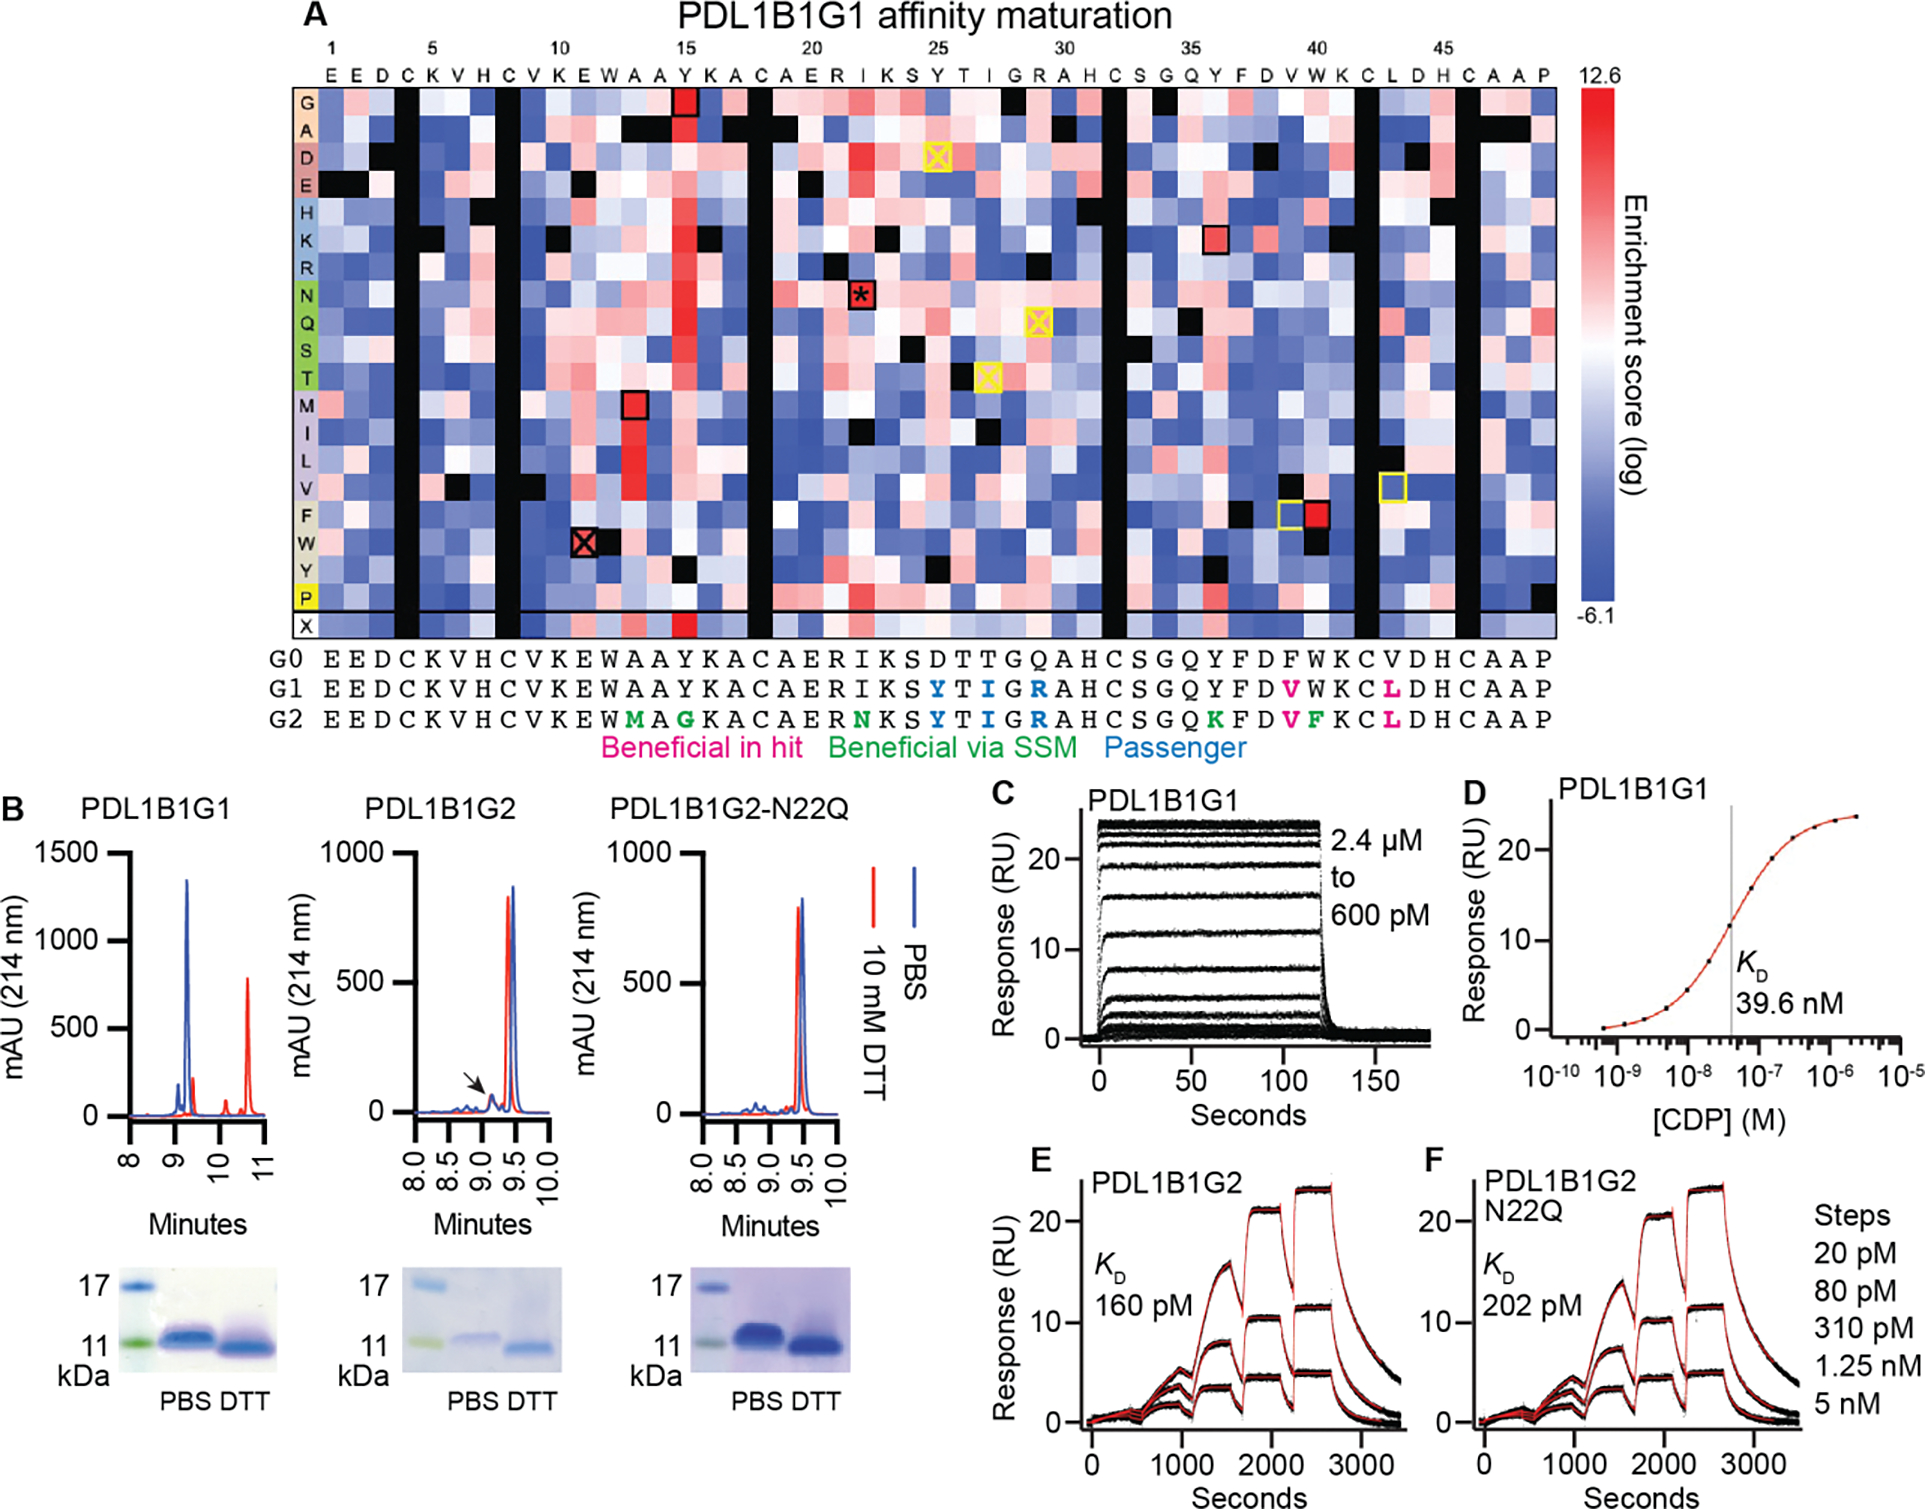
Fig. 5. Affinity maturation of PD-L1-binding CDP and soluble CDP characterization.

(A) Affinity maturation of PDL1B1G1. Heat map represents log2-transformed, normalized enrichment of each variant after two rounds of sorting (top ~7%) and regrowth. Positive enrichment scores represent increased relative abundance and therefore improved binding. Yellow box: detrimental reversion. Crossed out yellow box: Inconsequential reversion. Black box: beneficial and synergistic. Crossed out black box: beneficial but not synergistic. *: novel N-linked glycosite. Below the heatmap are sequences of the parental scaffold (here called G0 for PDL1B1G0), the primary hit (G1, PDL1B1G1), and the affinity-matured final variant (G2, PDL1B1G2), with beneficial (in original hit or via SSM) and passenger mutations indicated. (B) RP-HPLC and SDS-PAGE of recombinant PDL1B1G1, PDL1B1G2, and PDL1B1G2-N22Q. Arrowhead: possible minor species representing glycosylated PDL1B1G2. Note: mobility of CDPs in SDS-PAGE does not always correlate with size markers. For full SDS-PAGE gels, see fig. S12. (C-F) SPR traces of the three CDPs demonstrating a ~200-fold improvement in KD after affinity maturation. C: PDL1B1G1 steady-state traces. D: Steady-state curve fit. E: Single-cycle PDL1B1G2 traces. F: Single-cycle PDL1B1G2-N22Q traces. Black lines are data, red lines are the model fits.
