
Fig. 6. Co-crystallization of PDL1B1G2-N22Q with PD-L1.
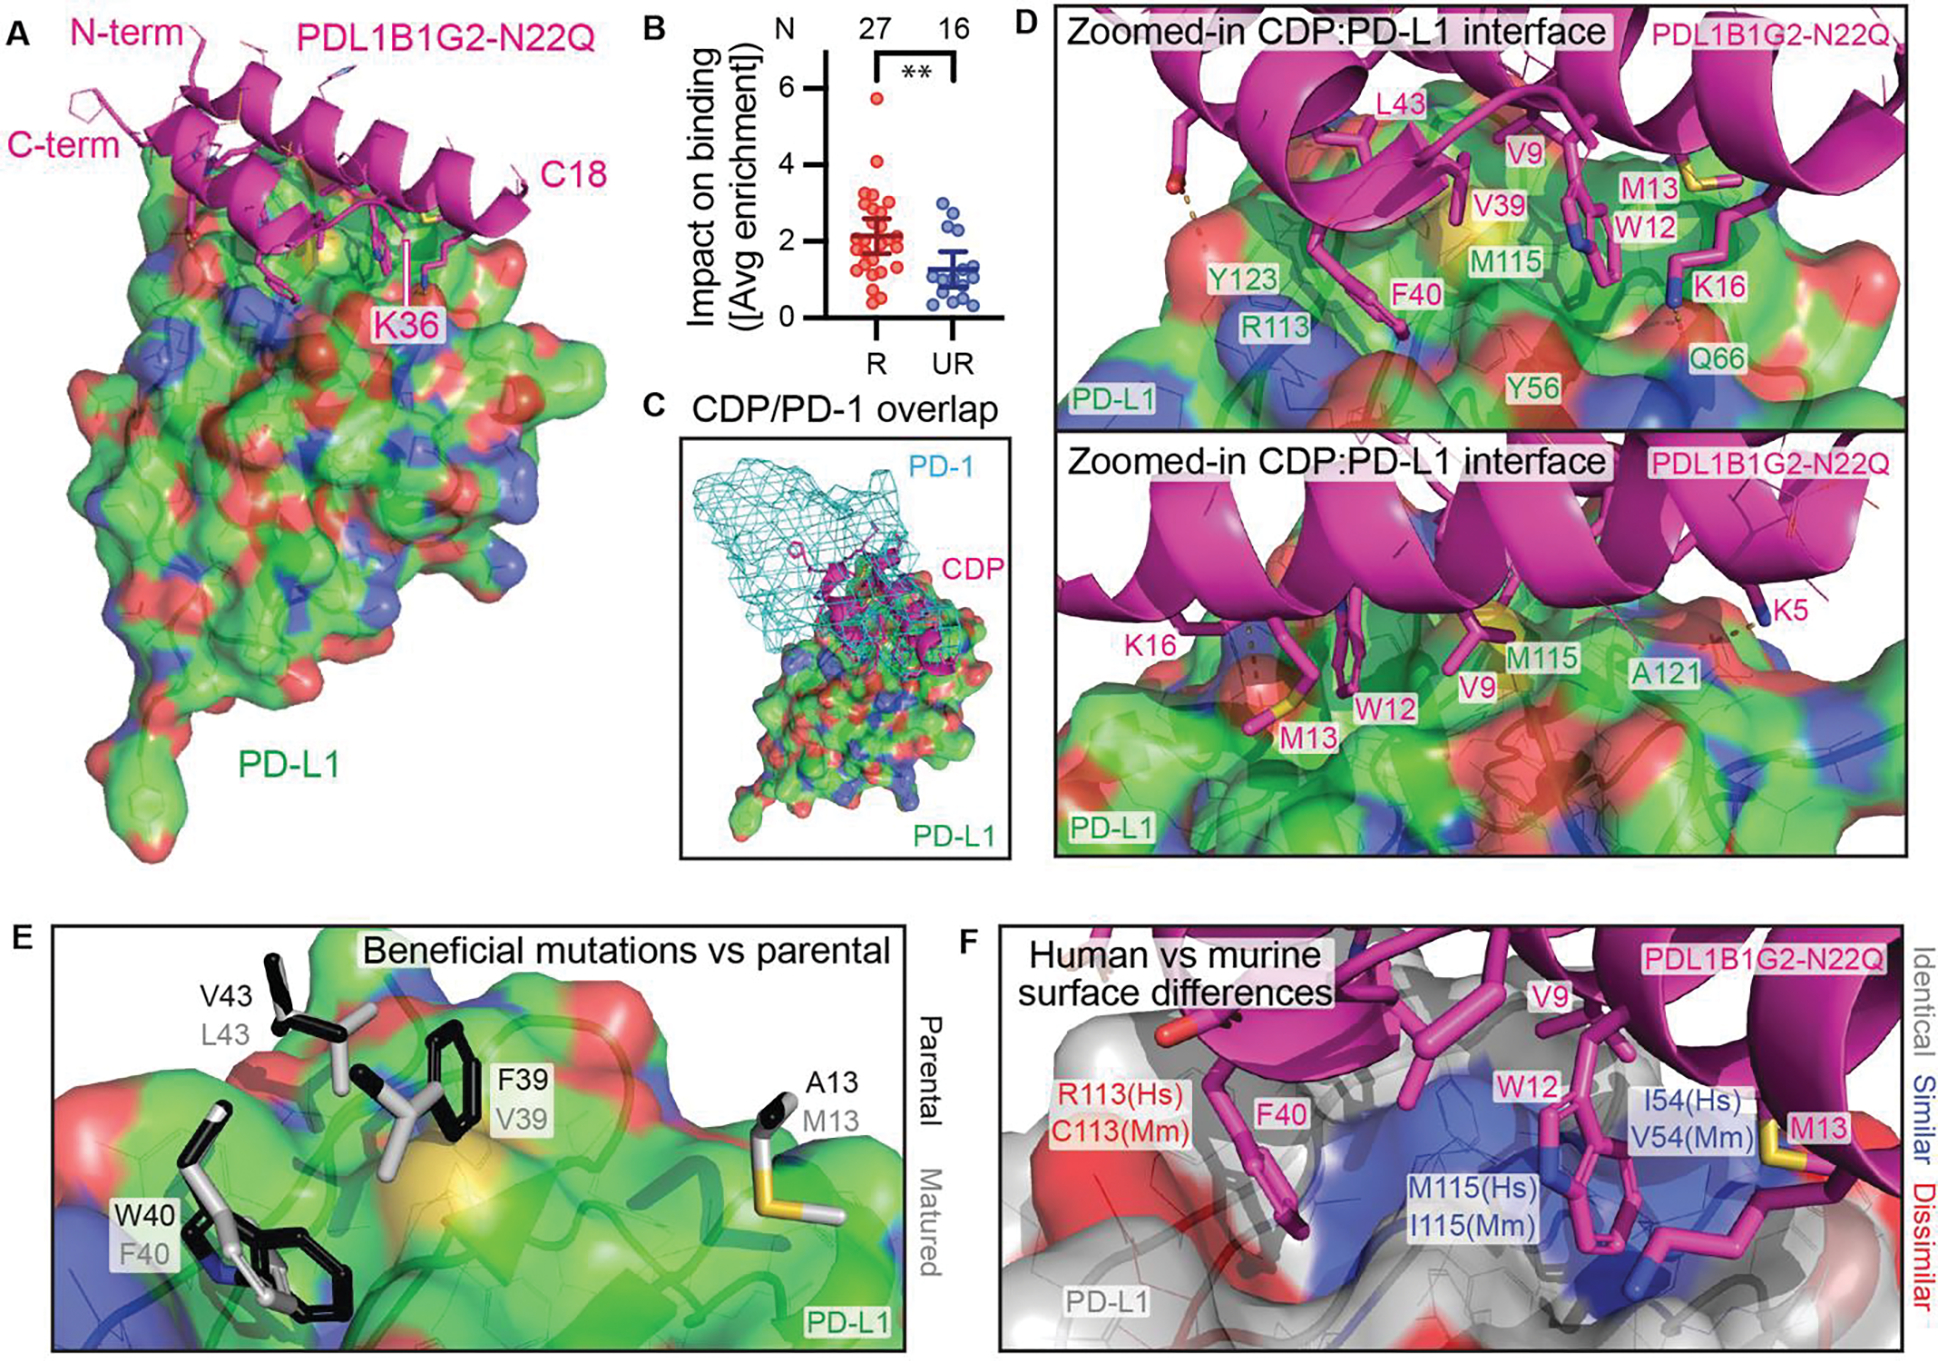
(A) Co-crystal structure of PDL1B1G2-N22Q (magenta cartoon) with PD-L1 (green surface). (B) Impact on binding (shown as absolute values of residues’ average SSM enrichment scores) of mutations to resolved (R; N = 27) residues compared to unresolved (UR; N = 16) residues, mean ± 95% CI. **P = 0.0055 by Mann-Whitney test. (C) PD-1 (cyan mesh surface, from PDB 4ZQK) binding site overlaps with CDP site. (D) From two different angles, a zoomed-in view of the CDP:PD-L1 interface. (E) Select side chains from PDL1B1G2-N22Q (white) at the PD-L1 interface are shown with parental residues (black, minimally clashing rotamers) superimposed. (F) CDP:PD-L1 interface where the PD-L1 surface is color-coded for human (Hs) vs murine (Mm) homology (white, identical residues; blue, similar; red, dissimilar). For surfaces in panels A, C, D, and E, and for side chain lines/sticks in all panels, non-C atoms are color-coded as follows: red, O; blue, N; yellow, S.