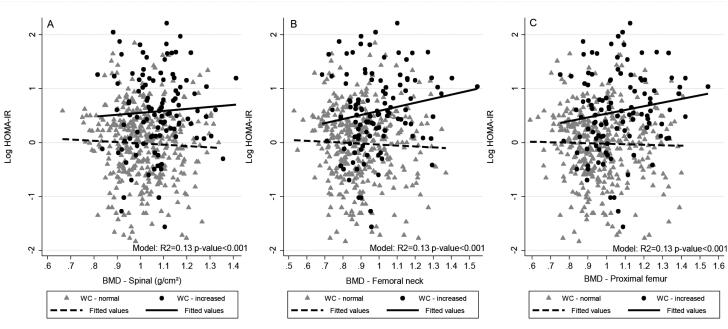
Figure 1. Scatter and linear prediction between BMD and Log HOMA1-IR according to WC in 468 young adults, 2002-2004 Ribeirão Preto, Brazil, fourth cross-sectional evaluation. A) Spinal BMD. B) Femoral neck BMD. C) Proximal femur BMD.
HOMA1-IR: homeostatic model assessment – insulin resistance; WC: waist circumference; BMD: bone mineral density.
Fitted values were predicted using linear regression models; WC was categorized using World Health Organization cutoff points, normal WC: < 80 cm for women and < 94 cm for men; increased WC: ≥ 80 cm for women and ≥ 94 cm for men.

