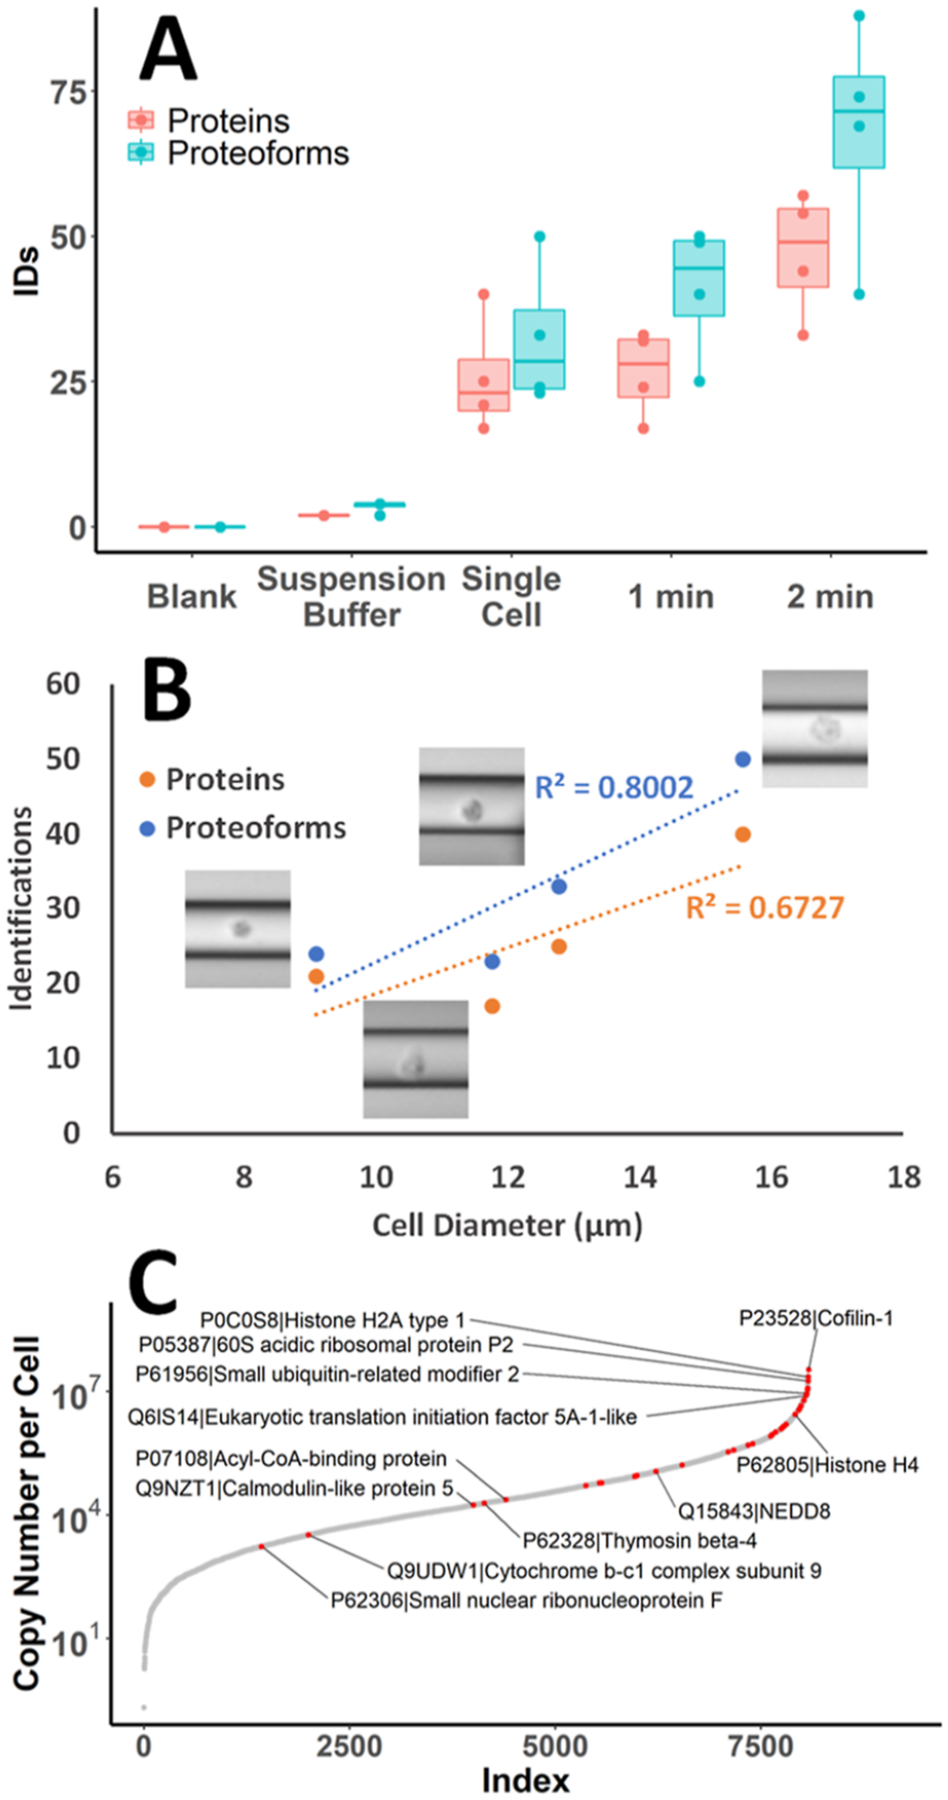
Figure 4.

Protein and proteoform identifications from single-cell and spray voltage injections analyzed by CE-MS/MS. (A) Boxplots show the range and median of protein and proteoform identifications for each injection mode tested, as well as blank sample buffer and suspension buffer alone (N = 4). Dots indicate values from individual samples. (B) Single HeLa cell protein and proteoform identifications plotted against measured cell diameters. Linear trendlines demonstrate the correlation between protein and proteoform identifications with cell size. (C) S-curve of protein copy numbers per cell from a previously reported deep proteomic study of HeLa,29 with proteins identified from a single HeLa cell TDP in this study mapped in red. Selected proteins of interest are labeled.
