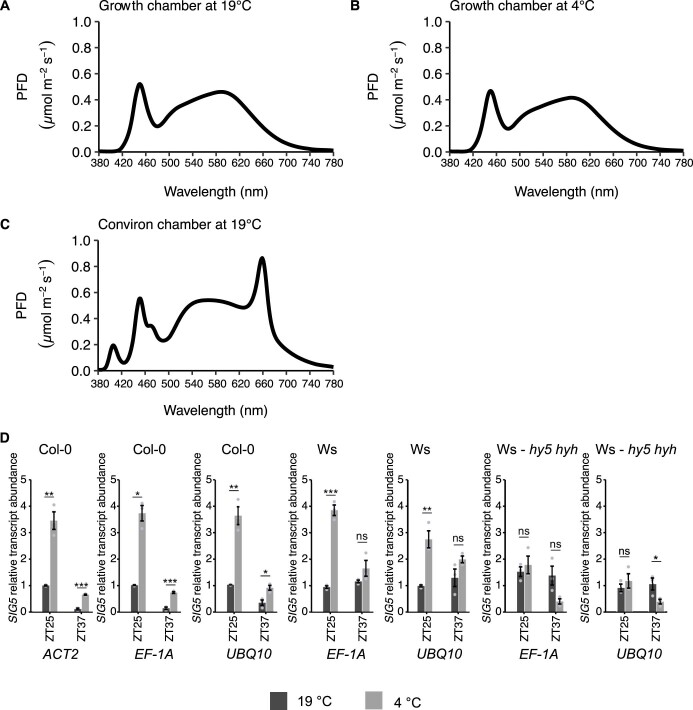
Extended Data Fig. 8. Light spectra and RT-qPCR controls.
Light spectra and RT-qPCR controls. (A, B) Comparison of spectra in Panasonic MLR-352 growth chambers set to (A) control and (B) cold temperature conditions. (C) Spectrum of Conviron growth chambers used to propagate mature plants. (D) Comparison of response of SIG5 to cold, at two different timepoints, in two background lines, and in the hy5 hyh double mutant. The transcript dynamics are broadly similar when each of ACT2, EF-1A and UBQ10 was used as a reference gene. *** = p < 0.001; ** = p < 0.01, * = p < 0.05 and n.s = not significant in unpaired two-sided t-tests, n = 3 biological replicates shown as mean + /- s.e.m. p values: Col-0 ACT2 (ZT25 0.002; ZT37 0.000), Col-0 EF-1A (ZT25 0.011; ZT37 0.000), Col-0 UBQ10 (ZT25 0.002; ZT37 0.014), Ws EF-1A (ZT25 0.000; ZT37 0.239), Ws UBQ10 (ZT25 0.006; ZT37 0.239), hy5 hyh EF-1A (ZT25 0.534; ZT37 0.57), hy5 hyh UBQ10 (ZT25 0.432; ZT37 0.048).

