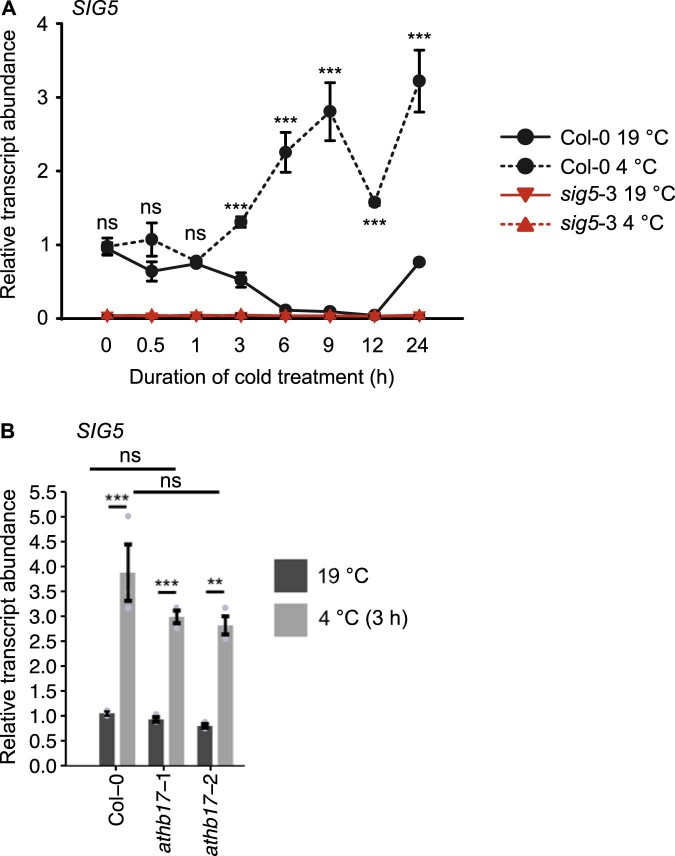
Extended Data Fig. 2. SIG5 transcript accumulation during cold treatments of up to 24 h.
SIG5 transcript accumulation during cold treatments of up to 24 h. (A) Relative abundance of SIG5 transcripts in Col-0 wild type and sig5-3 plants after cold treatment (4 °C) for durations ranging from 30 mins to 24 hours. (B) Abundance of SIG5 transcripts in wild type (Col-0) and two athb17 mutants after 3 h at 19 °C or 4 °C. Plants were under constant light conditions and given a 3 h cold treatment 1 h after subjective dawn. Experiments used 11-day old seedlings. Data are mean + /- s.e.m. (n = 3 independent biological replicates). Statistical comparisons are of (A) transcript abundance between Col-0 19 °C and Col-0 4 °C and (B) transcript abundance between control temperature and cold-treated plants, and between genotypes. Data analysed by (A) one-way ANOVA and (B) two-way ANOVA, both followed by one-sided post-hoc Tukey test, where *** = p < 0.001; ** = p < 0.01, * = p < 0.05 and n.s = not significant. p-values (A) 19 °C vs 4 °C for Col-0 at 0 h (p = 1.0000), 0.5 h (p = 0.9277), 1 h (p = 1.0000), 3 h (p = 0.1867), 6 h (p < 0.0001), 9 h (p < 0.0001), 12 h (p = 0.0001), 24 h (p < 0.0001); (B) 19 °C vs 4 °C for Col-0 (p = 0.0000425), athb17-1 (p = 0.0008523); athb17-2 (p = 0.0010056); Col-0 vs athb17-1 at 4 °C (p = 0.1958629); Col-0 vs athb17-2 at 4 °C (p = 0.0918899).

