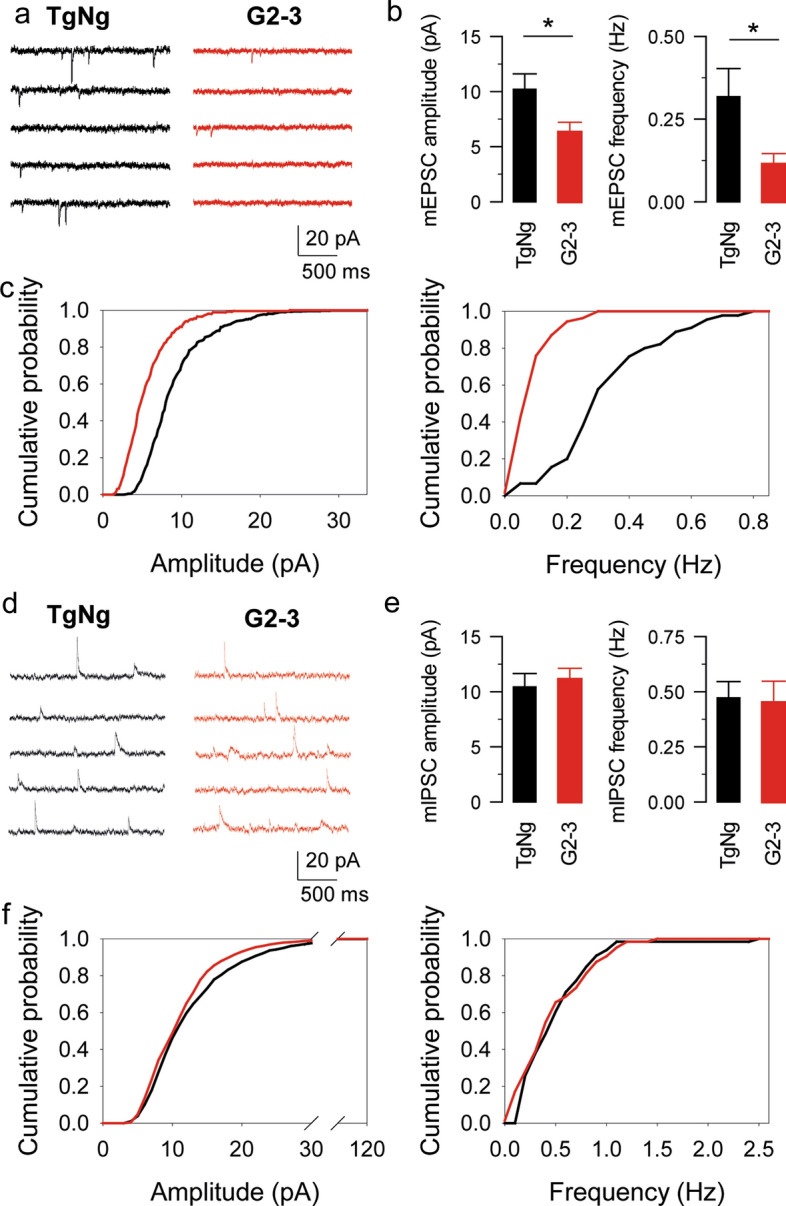
Fig. 2.

The increase in astrocyte Ca2+ event frequency observed in the G2-3 mice is not a consequence of an increase in neurotransmitter release. a mEPSC traces recorded from TgNg and G2-3 mice. b mEPSC amplitude and frequency obtained from TgNg and G2-3 mice. Data are expressed as mean ± s.e.m. (*) p < 0.05. c Cumulative probability of mEPSC amplitude (left; the maximum difference between the cumulative distributions, D, is 0.44781 with a corresponding p < 0.001) and mEPSC frequency (right; the maximum difference between the cumulative distributions, D, is 0.74444 with a corresponding p < 0.001). d mIPSC traces recorded from TgNg and G2-3 mice. e mIPSC amplitude and frequency obtained from TgNg and G2-3 mice. Data are expressed as mean ± s.e.m. f Cumulative probability of mIPSC amplitude (left; the maximum difference between the cumulative distributions, D, is 0.09153 with a corresponding p > 0.1) and mIPSC frequency (right; the maximum difference between the cumulative distributions, D, is 0.17188 with a corresponding p > 0.1)
