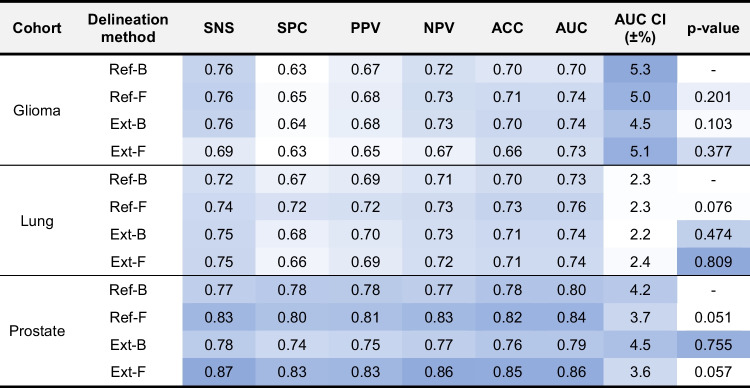
Table 3.
Performance values for glioma, lung and prostate cohorts relying on four delineation approaches to evaluate test cases within the harmonized 100-fold Monte Carlo cross-validation scheme. P-values represent the ANOVA analysis results in-between the reference binary delineation (Ref-B) and the other three delineation methods across the cross-validation area under the receiver operator characteristics curves (AUC). SNS Sensitivity; SPC specificity; PPV positive predictive value; NPV negative predictive value; ACC accuracy; CI confidence interval; Ext-B extended binary; Ref-B reference binary; Ext-F extended fuzzy; Ref-F reference fuzzy delineation. Color scale is normalized between the lowest (white) and the highest (blue) values in each category, where SNS – AUC, AUC CI (±%) and p-value form their own categories. Note that since the test subsets in the cross-validation scheme were balanced and the training subsets underwent class imbalance correction, ACC values reflect on a balanced classifier and they are in line with balanced accuracy (a.k.a. the average SNS and SPC)

