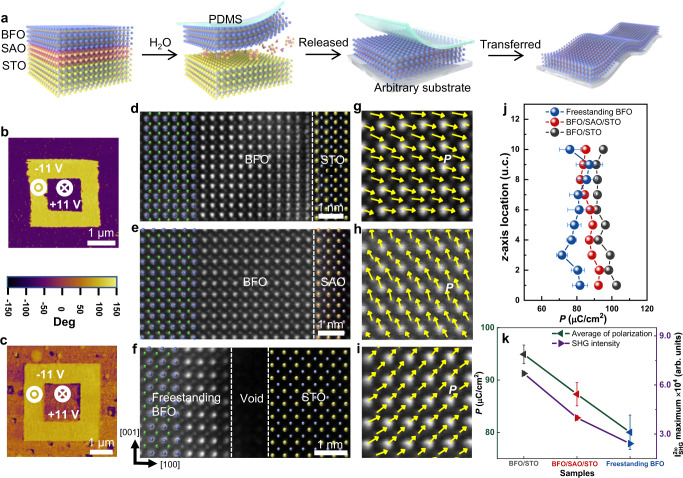
Fig. 1. Preparation and ferroelectric properties characterization of BFO films.
a Schematics of the whole fabrication process: from BFO/SAO/STO heterostructures to freestanding BFO films. b, c Out-of-plane PFM phase images of the epitaxial BFO films and the freestanding BFO films, respectively. d–f The cross-sectional STEM-HAADF images of BFO/STO, BFO/SAO/STO, and freestanding BFO transferred on STO, respectively. g–i The visualization of polarization in the corresponding films in d–f. The yellow arrows are plotted according to the displacement of Fe relative to the Bi sublattices, the position of which are determined by the two-dimensional Gaussian algorithm. j The average polarization magnitude calculated by the empirical equation. The error bar represents the standard deviation of measured unit-cells. k Comparison of the average polarization and the maximum value of SHG intensity for BFO/STO, BFO/SAO/STO, and freestanding BFO films at room temperature. The error bar represents the standard deviation of measured samples.

