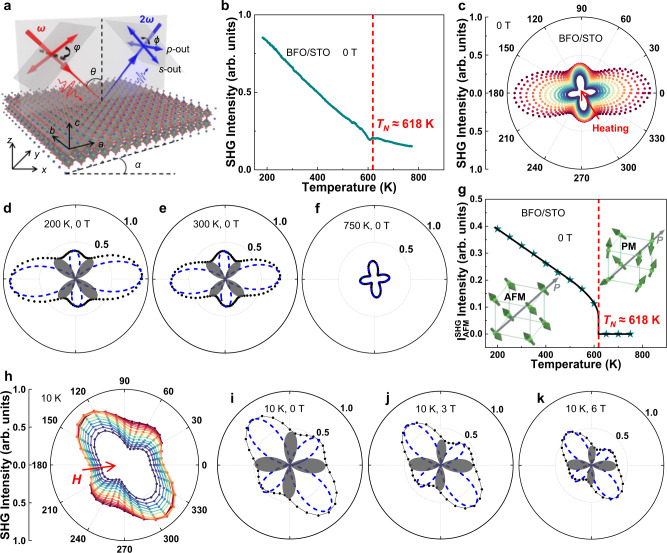
Fig. 2. Wide temperature-range (RA-) SHG and that with applied magnetic field (H) measurements.
a Schematic diagram of the polarization configuration in the reflective geometric light path. b The SHG intensity of BFO films as a function of temperature in the p-p polarization configuration. c RA-SHG measurements of BFO/STO films at different temperatures, the scattered points are the experimental data at different temperatures. d–f Theoretical fitting results of RA-SHG measurements of BFO/STO films at 200, 300, and 750 K, respectively. The scattered points are experimental data, the blue dashes represent the contribution of the ferroelectric order to the SHG signal, and the gray shaded areas represent the contribution of the antiferromagnetic order to the SHG signal. g Temperature dependent SHG signals contributed by antiferromagnetic order extracted from RA-SHG measurements. Insets: Schematic diagrams of antiferromagnetic order and paramagnetic order. h RA-SHG of freestanding BFO films under different magnetic fields. i–k Theoretical fitting results of RA-SHG measurements of freestanding BFO films at 0, 3, and 6 T, respectively. The dotted lines are experimental data, the blue dashes represent the contribution of the ferroelectric order to the SHG signal, and the gray shaded areas represent the contribution of the antiferromagnetic order to the SHG signal.

