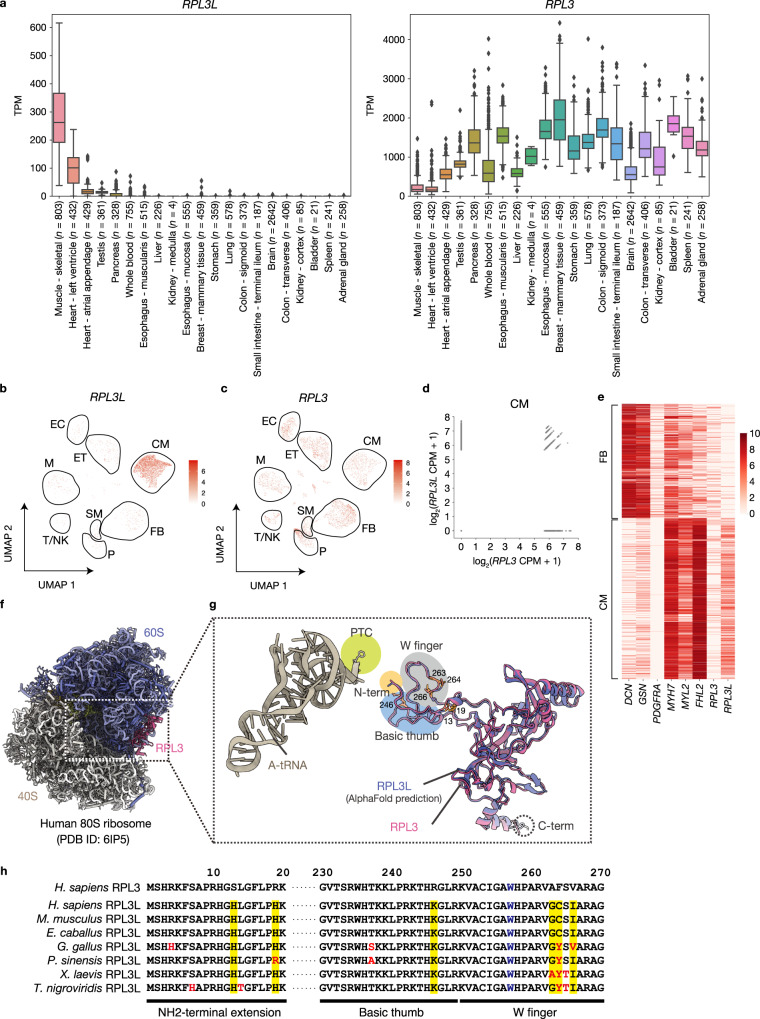
Fig. 1. Expression pattern and predicted structure of RPL3L.
a Expression patterns of RPL3L and RPL3 in human tissues. The RNA-seq data were obtained from the GTEx portal and are presented as box-and-whisker plots, with the boxes representing the median and upper and lower quartiles and the whiskers representing the maximum and minimum values. Diamond-shaped dots indicate outliers. TPM, transcripts per million. b, c UMAP (Uniform Manifold Approximation and Projection) plots from Seurat analysis of scRNA-seq data for RPL3L and RPL3 expression in the human heart. Data are from GSE183852. Groups corresponding to cardiomyocytes (CM), smooth muscle (SM), fibroblasts (FB), pericytes (P), T cells and natural killer cells (T/NK), macrophages and monocytes (M), endothelium (ET), and endocardium (EC) are enclosed in black frames. d Expression levels of RPL3 and RPL3L in single cells for cardiomyocytes as in b and c. CPM, counts per million. e Heat map showing row-scaled expression of the marker genes for FB and CM as well as of RPL3 and RPL3L for the FB and CM clusters in b and c. f, g Structural comparison for RPL3 and RPL3L. The atomic model of RPL3 is highlighted (magenta) in the model of the human 80S ribosome obtained by cryo-EM (PDB ID: 6IP5) (f). The three fingerlike projections—the NH2-terminal extension (N-term), the W finger, and the basic thumb—of RPL3/RPL3L extend into the core region of the 60S subunit and are situated in close proximity to the CCA terminus of the A-tRNA in the PTC (g). The amino acids that differ between RPL3 and RPL3L is highlighted in orange with their amino acid numbers. h Comparison of amino acid sequences of human (Homo sapiens) RPL3 with those of human RPL3L as well as of RPL3L from other mammalian (Mus musculus and Equus caballus), avian (Gallus gallus), reptile (Pelodiscus sinensis), amphibian (Xenopus laevis), and fish (Tetraodon nigroviridis) species. Amino acids that differ between human RPL3 and the various RPL3L proteins are highlighted in yellow, and those of RPL3L that differ among species are shown in red. The W residue in blue corresponds to W255 of yeast Rpl3.

