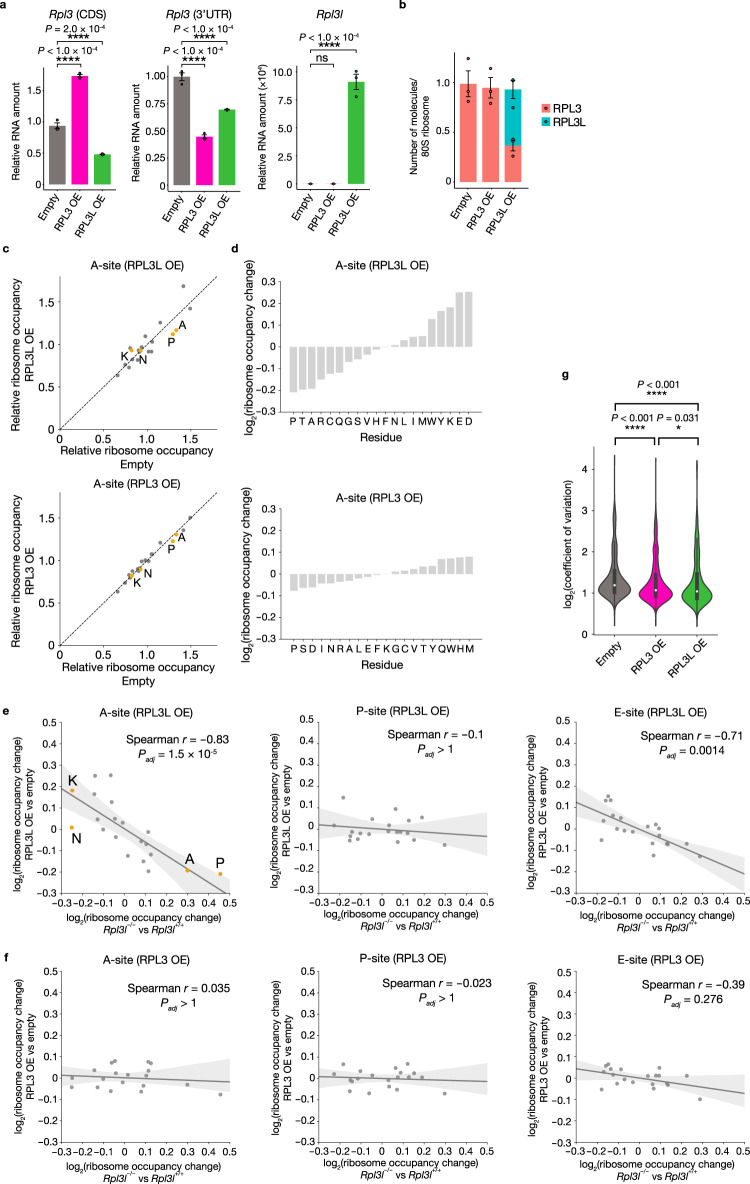
Fig. 4. Negative correlation of translation elongation dynamics between conditions of RPL3L overexpression or loss.
a RT-qPCR analysis of Rpl3 and Rpl3l mRNA abundance in C2C12 cells stably expressing RPL3 (RPL3 OE) or RPL3L (RPL3L OE) or in those infected with the corresponding empty retrovirus (n = 3 biologically independent samples). Rpl3 transcripts were measured with primers targeting the coding sequence (CDS) or 3’UTR. Data are means ± s.d. b Number of RPL3 or RPL3L molecules per 80S ribosome as determined by MRM analysis of the polysome fraction from RPL3 OE or RPL3L OE cells (n = 3 biologically independent samples). Data are means±s.d. c Relative ribosome occupancy at A-site codons in RPL3L OE and RPL3 OE cells. Data were aggregated according to all codons for each amino acid (n = 3 biologically independent samples). d Ribosome occupancy changes at A-site codons for each amino acid residue in RPL3L OE or RPL3 OE cells compared with control cells (n = 3 biologically independent samples). e, f Correlation of fold change in ribosome occupancy at A-, P-, and E-site codons for RPL3L OE or RPL3 OE cells (relative to control cells) (n = 3 biologically independent samples) with that for the heart of Rpl3l−/− mice (relative to that of control mice) (n = 4 mice). Spearman’s correlation coefficient (r) with associated P value (two-sided) is indicated for each comparison. Adjusted P values were calculated by the Bonferroni method for multiple comparisons. Gray bands indicate 95% confidence intervals. g Violin plots for the CV of ribosome occupancy at the A-site in RPL3L OE, RPL3 OE, and control cells (n = 3 biologically independent samples). The inner boxes represent the median and upper and lower quartiles, and the whiskers represent the maximum and minimum values. *P < 0.05, ****P < 0.001, ns (two-tailed Dunnett’s test (a) or Steel-Dwass test (g)). Source data are provided as a Source Data file.

