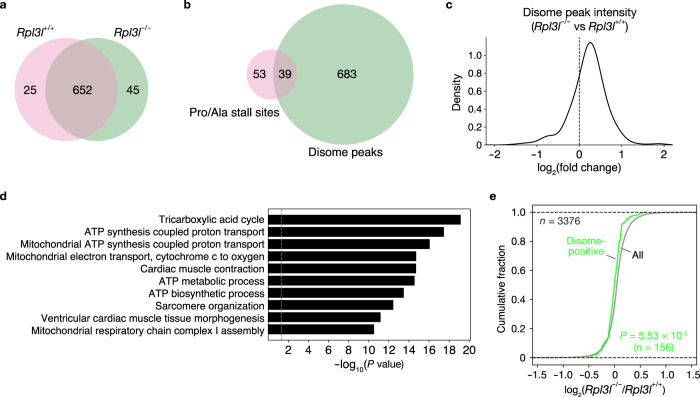
Fig. 7. Increased ribosome collision in the RPL3L-deficient heart.
a, b Venn diagrams for the number of disome peaks in the heart of Rpl3l+/+ or Rpl3l−/− mice (n = 4 mice) (a) as well as for the number of Pro/Ala codons with significantly increased ribosome occupancy at the A-site in the heart of Rpl3l−/− mice compared with that of control mice (b). c Histogram for fold change in disome peak intensity in the heart of Rpl3l−/− mice compared with that of control mice (n = 4 mice). The black dotted line corresponds to a fold change of 1. d GO analysis of genes with disome peaks in the heart of Rpl3l+/+ or Rpl3l−/− mice. P values were calculated as EASE scores, modified Fisher’s exact P values. The 10 GO terms with the smallest P values are listed. e Cumulative fraction for the fold change in protein expression in the heart of Rpl3l−/− mice compared with that of control mice (n = 4 mice). The expression level of proteins was analyzed by DIA-based MS, and the results are shown for all proteins (n = 3376) and for those with disome peaks (n = 156) in a. The P value was calculated with the two-tailed Mann-Whitney U test. Source data are provided as a Source Data file.

