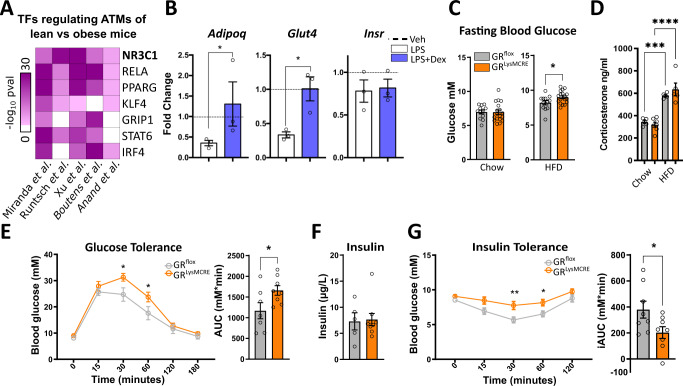
Fig. 1. GR in macrophages protects against insulin resistance.
A Differentially expressed genes (padj < 0.05) of published expression datasets from macrophages analyzed by LISA to predict regulatory transcription factors. B In vitro differentiated adipocytes from stromal vascular fraction (SVF) were co-cultured with bone marrow-derived macrophages (BMDMs) for 24 h. Macrophages were pretreated with vehicle, LPS (100 ng/ml), or LPS + dex (100 nM) for 24 h, followed by washout before co-culturing. Adipocytes were separated via MACS and gene expression was quantified by qPCR relative to vehicle control (dotted line) (n = 3, N describes macrophages from individual mice). C Blood glucose was analyzed before and after 29 weeks of a 60% high-fat diet (GRflox: n = 12, GRLysMCre: n = 18, N describes individual mice). D Corticosterone levels were measured by MS from lean and obese GRflox and GRLysMCre mice (GRflox: n = 5, GRLysMCre (lean): n = 7, GRLysMCre (obese): n = 5). E Overnight fasted obese mice were given 2 mg/g glucose i.p., and blood glucose levels were traced for 180 min. The area under the curve, right (GRflox: n = 7, GRLysMCre: n = 8). F After cull, fasted insulin levels were analyzed in serum by ELISA (GRflox: n = 5, GRLysMCre: n = 9, N describes individual mice). G Mice were fasted for 4 h, and given 0.5 µ i.U./g insulin i.p.; blood glucose levels were traced for 120 min. The area above the curve, right (n = 7–8). Data show mean ± SEM. Statistical analysis via two-tailed Student’s t-test (B, C, D, E AUC, G, G AUC) or two-way ANOVA with repeated measures using a Bonferroni post-hoc test (D, F), Wilcoxon rank-sum test (A). Exact p values B Adipoq: 0.0500, Glut4: 0.0101, C 0.0376, D Chow vs HFD GRflox: 0.0003, Chow vs HFD GRLysMCre: <0.0001, E 30 min: 0.0032, 60 min: 0.0057, AUC: 0.0222, G 30 min: 0.0022, 60 min: 0.0040, iAUC: 0.0052.

