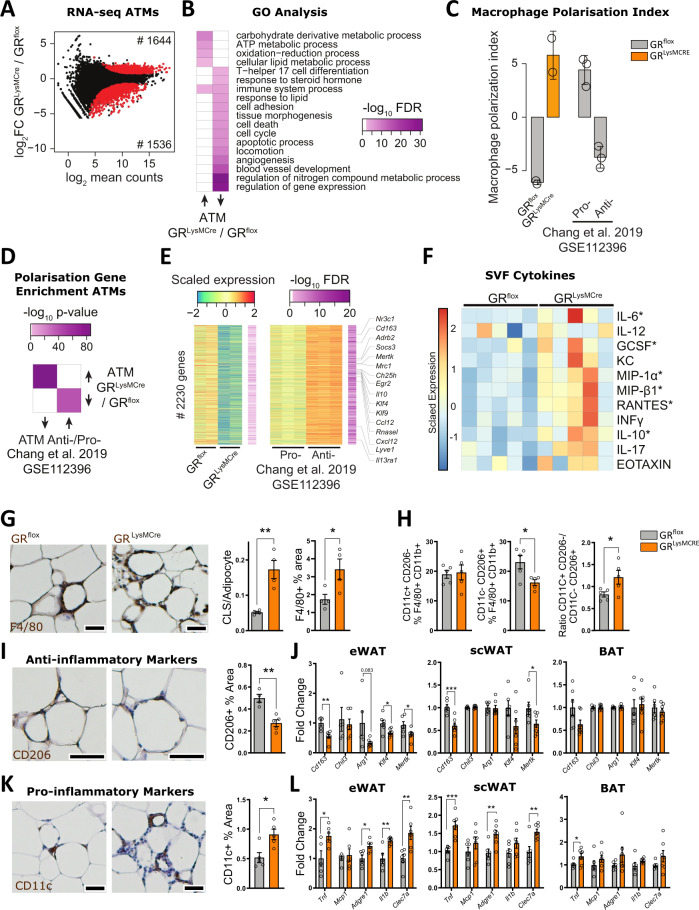
Fig. 2. GR in macrophages protects against adipose tissue inflammation.
A MA plot of RNA-seq data from eWAT-derived ATMs of obese GRflox and GRLysMCre mice (n = 2). Red dots show differentially expressed genes (padj <0.01). B Heatmap showing gene ontology enrichment of genes with higher (left) and lower (right) expression in ATMs from GRLysMCre compared to GRflox mice from data shown in (A). C Macrophage polarization index based on RNA-seq counts from GRflox and GRLysMCre ATMs shown in (A) and pro- and anti-inflammatory ATMs from eWAT of obese mice (n = 2–3). D Heatmap depicting enrichment of up- and downregulated genes between GRLysMCre vs. GRflox ATMs shown in (A) and anti- vs. pro-inflammatory ATMs33 using a one-sided hypergeometric test. E Heatmap of 2230 genes with decreased comparing GRLysMCre vs. GRflox ATMs from the analysis shown in (A) and increased expression pattern comparing anti- vs. pro-inflammatory ATMs33. Macrophage polarization genes are highlighted. F SVF isolated from eWAT of obese GRflox and GRLysMCre mice was cultured overnight, and the supernatant was analyzed by multiplex or ELISA (INFy) (n = 5). G eWAT was stained for F4/80 by IHC, and quantified (right). Crown-like structures (CLS) were quantified (left) (n = 4, N describes individual mice). H SVF isolated from eWAT was analyzed by FACS for a fraction of pro-inflammatory (CD11c+;CD206−) and anti-inflammatory (CD11c−;CD206+) cells per F4/80 +/CD11b+ macrophages and their ratio (n = 5, N describes individual mice). I eWAT was stained for CD206 by IHC, and quantified (GRflox n = 4, GRLysMCre n = 5, N describes individual mice). J mRNA expression of anti-inflammatory marker genes of eWAT, scWAT, and BAT was assessed by RT-qPCR (n = 5–6 eWAT, 6–7 scWAT and BAT, N describes individual mice). K eWAT was stained for CD11c by IHC and quantified (n = 5, N describes individual mice). L eWAT, scWAT, and BAT gene expression for inflammatory markers were analyzed by RT-qPCR (eWat GRflox: Tnf n = 5, Mcp1 n = 6, Adgre1 n = 6, Il1b n = 5, Clec7a n = 6; GRLysMCre: Tnf n = 6, Mcp1 n = 6, Adgre1 n = 6, Il1b n = 6, Clec7a n = 6. scWat GRflox: Tnf n = 6, Mcp1 n = 6, Adgre1 n = 6, Il1b n = 6, Clec7a n = 6; GRLysMCre: Tnf n = 6, Mcp1 n = 6, Adgre1 n = 6, Il1b n = 6, Clec7a n = 6. Bat GRflox: Tnf n = 5, Mcp1 n = 6, Adgre1 n = 6, Il1b n = 5, Clec7a n = 6; GRLysMCre: Tnf n = 6, Mcp1 n = 6, Adgre1 n = 5, Il1b n = 6, Clec7a n = 6, N describes individual mice). Data show mean ± SEM. Statistical analysis via two-tailed Student’s t-test and Deseq with Benjamini–Hochberg correction padj <0.01 (A); p < 0.05*, p < 0.01**, p < 0.001***, p < 0.0001****. Images were obtained at ×10 original magnification. Exact p values: G CLS: 0.0033, F4/80 Area: 0.0396, H 0.0235, I 0.0019, J eWat: Cd163: 0.0023, Arg1: 0.0830, Klf4: 0.0143, Mertk: 0.0406, scWat: Cd163: 0.0007, Mertk: 0.0493, K 0.0130, L eWat: Tnf: 0.0217, Adgre1: 0.0101, Il1b: 0.0046, Clec7a: 0.0079, scWat: Tnf: 0.0004, Adgre1: 0.0061, Clec7a: 0.0054, BAT: Tnf: 0.0410. Scale bar: 100 µm in (G, I, K).

