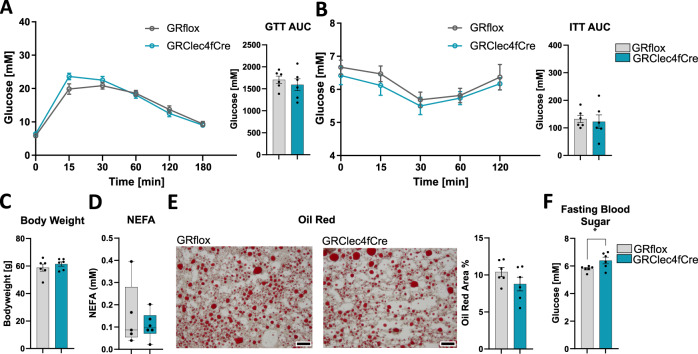
Fig. 4. Selective elimination of GR in Kupffer cells does not increase IR, lipolysis, and steatosis after HFD.
A Overnight fasted obese, 29 weeks of HFD, GRflox, and GRClec4fCre mice were given 2 mg/g glucose i.p., and blood glucose levels were traced for 180 min. The area under the curve, right (n = 6). B Obese GRflox and GRClec4fCre mice were fasted for 4 h, and given 0.5 µ i.U./g insulin i.p., and blood glucose levels were traced for 120 min. The area above the curve, right (n = 6). C Body weight at the time of dissection from obese GRflox and GRClec4fCre mice (n = 6). D Serum NEFA (n = 6). E Oil red o quantified from livers of obese GRflox and GRClec4fCre mice (n = 6). F Fasting blood sugar (glucose) measured after overnight fast (n = 6). Data show mean ± SEM. Boxplots show median, IQR, and min/max values. Statistical analysis via two-tailed Student’s t-test (A AUC: 0.4889, B AUC: 0,7386, C, D, E, F) or two-way ANOVA with repeated measures using a Bonferroni post-hoc test (A 0.4229, B 0.5197). Exact p values F 0.0476. Scale bar: 200 µm in (D).

