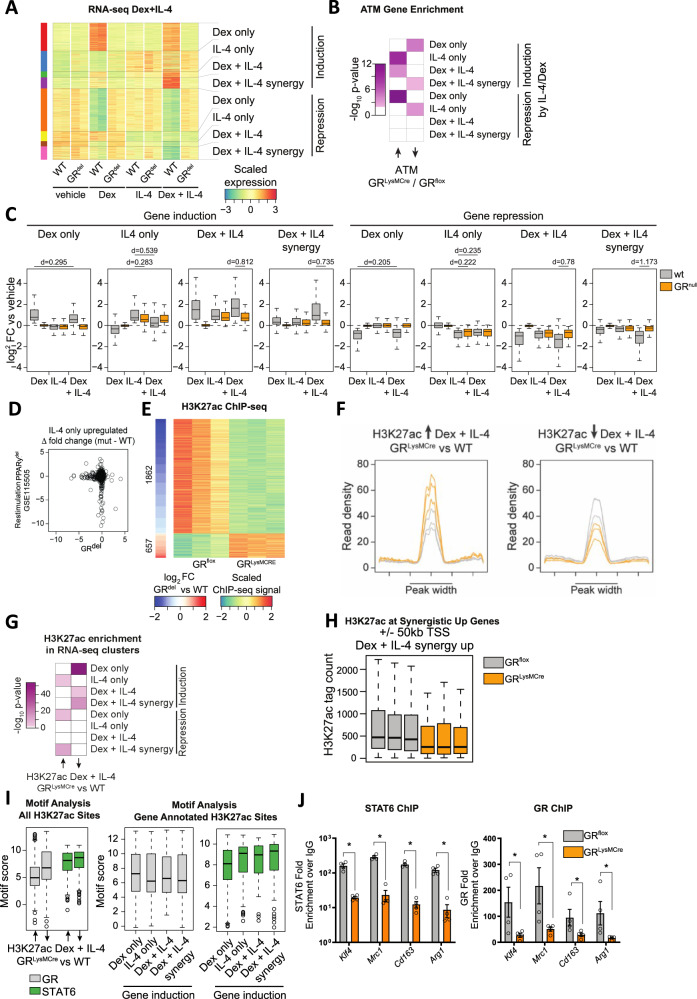
Fig. 5. GR regulates macrophage alternative activation through cooperation with STAT6.
A Heatmap depicting distinct patterns of differentially expressed genes (padj <0.01) in RNA-seq data of WT or GRdel macrophages treated with either vehicle (DMSO), dex (100 nM), IL-4 (20 ng/ml), or IL-4 + dex for 2 h (n = 2). B Heatmap showing enrichment of up- and downregulated genes comparing GRLysMCre vs. GRflox ATMs from Fig. 2A for dex only, IL-4 only, dex + IL-4 or dex + IL-4 synergistic genes in (B) using a one-sided hypergeometric test. C Boxplots depicting log2 fold changes with respect to vehicle control for dex only, IL-4 only, dex + IL-4, or dex + IL-4 synergistic genes in (A). The effect size for selected comparisons is indicated as Cohen’s d (n = 2). D Scatter plot quantifying the lack of gene induction by IL-4 stimulation upon deletion of PPARγ over deletion of GR for all genes of the IL-4 only upregulated gene cluster from (A). E Heatmap depicting H3K27ac ChIP-seq signal for enhancers with significantly different H3K27ac levels (padj <0.05) between GRLysMCre and WT BMDMs treated with dex + IL-4 (n = 3). F Density plot showing the distribution of H3K27ac signals at sites that gain and lose signal in GRflox and GRLysMCre macrophages. G Enrichment of genes nearby (±50 kb from TSS) enhancers with increased or decreased H3K27ac levels between GRLysMCre and GRflox macrophages in (E) for dex only, IL-4 only, dex + IL-4 or dex + IL-4 synergistic genes in (A). Hypergeometric test one-sided. H H3K27ac tag count at enhancers with dynamic H3K27ac levels between GRLysMCre and GRflox macrophages in (E) in the vicinity (±50 kb from TSS) of genes showing synergistic upregulation by dex + IL-4 in (A). I HOMER-based motif score for GR and STAT6 at enhancers with loss and gain of H3K27ac ChIP-seq signal from (E) (left panel) and subgrouping those enhancers based on proximity to genes with dex only, IL-4 only, dex + IL-4, and dex + IL-4 synergistic regulation patterns from (A) (n for enhancers going up: 1862, n for enhancers going down 657). J GRflox or GRLysMCre BMDMs were treated with IL-4 + dex for 2 h, and STAT6 or GR DNA binding was analyzed by ChIP-PCR (n = 4, N describes macrophages isolated from individual mice). Data show mean ± SEM. Boxplots show median, IQR, and min/max values excluding outliers. Statistical analysis via, Mann–Whitney test, two-sided, Deseq with Benjamini–Hochberg correction padj <0.01 (A); P < 0.05*, p < 0.01**, p < 0.001***, p < 0.0001**** Exact p values: J Stat6: Klf4: 0.0286, Mrc1: 0.0286, Cd163: 0.0286, Arg1: 0.0286, GR: Klf4: 0.0286, Mrc1: 0.0286, Cd163: 0.0286, Arg1: 0.0286.

