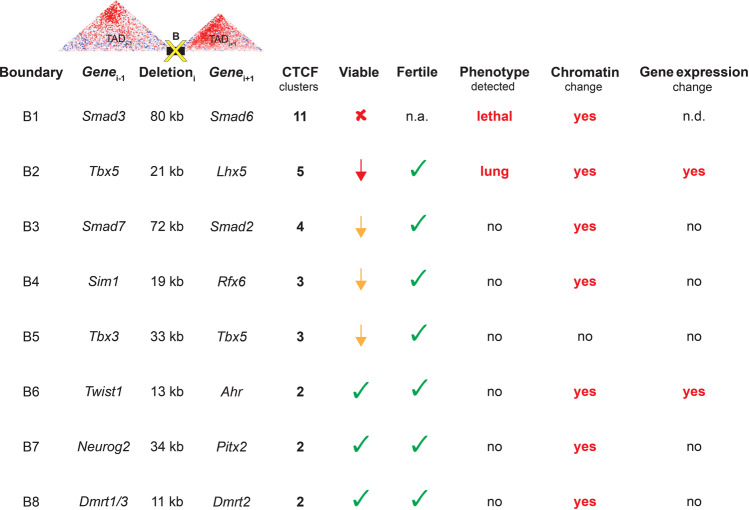
Fig. 5. Summary of findings.
Columns show specific TAD boundaries (B1–8) deleted in this study, key developmental genes within the flanking TADs (Genei-1 and Genei+1), approximate boundary deletion sizes (Deletioni), and the number of putative CTCF clusters deleted. All data in subsequent columns are summaries of phenotypic information for mice homozygous for the respective TAD boundary deletions. These include effects on viability (fully lethal in red cross mark, subviable shown in red or yellow arrow to indicate magnitude of effect, no deviation from expected Mendelian ratios shown in green check marks), fertility of both male and female homozygous animals (at least three homozygous males and three homozygous females were assessed for reproductive fitness, green check marks indicate fertile animals), and overt physiological phenotypes observed. Column for chromatin change indicates presence of significant DI changes and/or significant alterations to intra-domain chromatin contact frequencies in the flanking TADs, assessed by Hi-C. The last column indicates whether significant expression changes were observed for genes in the vicinity of the deleted TAD boundary. n.a. not applicable, n.d. not determined.

