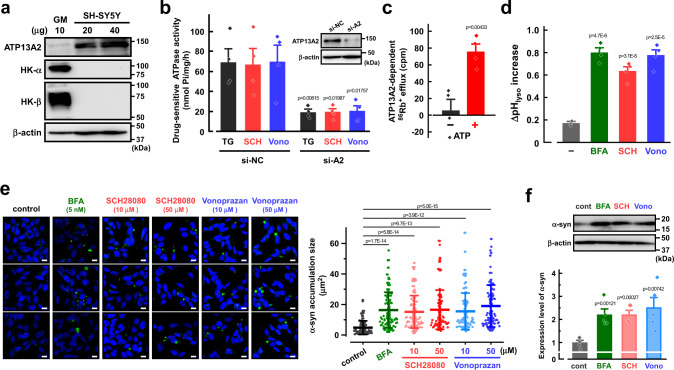
Fig. 4. Effects of inhibitors of gastric H+,K+-ATPase (P-CABs) and vacuolar H+-ATPase on endogenous ATP13A2 activity in SH-SY5Y cells.
a Expression of ATP13A2, H+,K+-ATPase α- and β-subunits (HK-α and HK-β), and β-actin in SH-SY5Y cells and human gastric mucosa (GM). Typical Western blot images in three independent experiments are shown. b Effects of TG (5 μM), SCH28080 (SCH; 10 μM), and vonoprazan (Vono; 10 μM) on the ATPase activity in the ATP13A2 siRNA- (si-A2) or negative control siRNA (si-NC)-transfected SH-SY5Y cells. (n = 4 independent replicates). Insert shows Western blot images for ATP13A2 and β-actin in the cells. Statistical significance was determined by two-tailed unpaired Student’s t test. c The ATP13A2-dependent 86Rb+ efflux from lysosomes in the presence and absence of ATP. The ATP13A2-dependent component was assessed as the difference between the 86Rb+ efflux in the ATP13A2-siRNA- and negative control siRNA-transfected SH-SY5Y cells. (n = 4 independent replicates). Statistical significance was determined by two-tailed unpaired Student’s t test. d Effects of bafilomycin A1 (BFA; 5 nM), SCH28080 (SCH; 50 μM), and vonoprazan (Vono; 50 μM) on the lysosomal pH. In SH-SY-5Y cells, the lysosomal pH was measured at 0 and 30 min after treatment of each drug. Then, the pH difference (ΔpHlyso) between 0 and 30 min was calculated. (n = 4 independent replicates). Statistical significance was determined by two-tailed unpaired Student’s t test. e Effects of bafilomycin A1 (BFA), SCH28080, and vonoprazan on the phosphorylated α-synuclein (α-syn) level in SH-SY5Y cells. Scale bars, 10 µm. The size of phosphorylated α-synuclein accumulation was measured. (n = 88-98 cells in three independent experiments). Statistical significance was determined by two-tailed unpaired Student’s t test. f Western blotting for α-synuclein and β-actin in the SH-SY5Y cells treated with bafilomycin A1 (BFA; 5 nM), SCH28080 (SCH; 10 μM), vonoprazan (Vono; 10 μM). Expression level of α-synuclein was normalized to that of β-actin. The expression level of α-synuclein in SH-SY5Y cells with no drug (cont) was taken as 1. (n = 5 independent replicates). Statistical significance was determined by two-tailed unpaired Student’s t test. Data in (a–d) and (f) are presented as mean ± SEM. Data in e is presented as mean ± SD. Source data are provided as a source data file.

