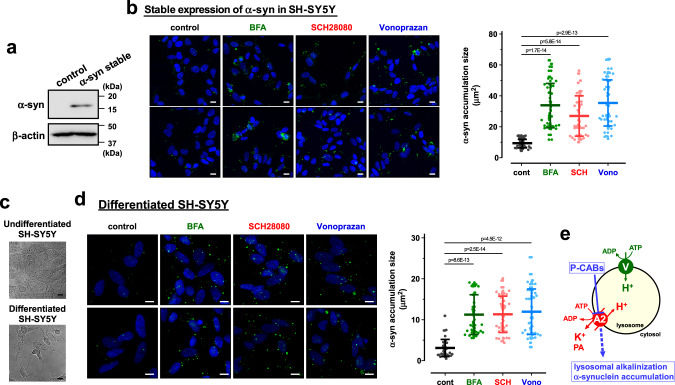
Fig. 5. Phosphorylated α-synuclein accumulation in the undifferentiated SH-SY5Y cells stably expressing α-synuclein and differentiated SH-SY5Y cells.
a Expression of α-synuclein (α-syn) and β-actin in the SH-SY5Y cells stably expressing α-synuclein. Typical Western blot images in three independent experiments are shown. b Effects of bafilomycin A1 (BFA; 5 nM), SCH28080 (SCH; 10 μM), and vonoprazan (Vono; 10 μM) on the phosphorylated α-synuclein (α-syn) level in the cells stably expressing α-synuclein. Scale bars, 10 µm. The size of phosphorylated α-synuclein accumulation was measured. (n = 40 cells in three independent experiments). Statistical significance was determined by two-tailed unpaired Student’s t test. c Typical microscopic images of differentiated and undifferentiated (control) SH-SY5Y cells in three independent experiments. The control cells were differentiated by treatment with 10 μM retinoic acid for 3 days and 50 ng/ml of BDNF for another 3 days. Scale bars, 10 µm. d Effects of bafilomycin A1 (BFA; 5 nM), SCH28080 (SCH; 10 μM), and vonoprazan (Vono; 10 μM) on the phosphorylated α-synuclein (α-syn) level in the differentiated SH-SY5Y cells. Scale bars, 10 µm. The size of phosphorylated α-synuclein accumulation was measured. (n = 40 cells in three independent experiments). Statistical significance was determined by two-tailed unpaired Student’s t test. e Schematic model showing the property of ATP13A2 in the lysosome. ATP13A2 (A2) functions as an H+,K+-ATPase, and its inhibition by P-CABs leads to lysosomal alkalinization and α-synuclein accumulation. V, vacuolar H+-ATPase. PA, polyamines. All data are presented as mean ± SD. Source data are provided as a source data file.

